FT-001The life of a money, part 2
Where money comes from
Most money is a bank's promise: a loan creates it, and repayment destroys it. Notes and coin are a minority. Real value is made by producing what people want. Over decades and countries, faster money growth moved with faster inflation, and with real growth weakly or not at all. A share that doubles creates no money.
Tap or click a dot for its source, a number for where it comes from and an underlined word for its meaning.
When your bank lends someone the price of a car, where does that money come from? It is not other people's savings handed over, and it does not come from the central bank's printing presses. The bank writes it. This study follows money to where it is made today and to where it first came from. The study keeps money, real value and prices apart. Money is the set of promises that settle payments: notes, bank deposits, and what banks hold in their accounts at the central bank. Real value is the goods and services people make, and the things they make them with, such as tools and machines. Prices say how much money it takes to buy something, from a coffee to a share or a house.
Short versionComplete on its own. About 2 minutes to read.
The answer in brief
Most money is a bank's promise. A bank creates it when someone borrows, and it is destroyed when the loan is repaid (who creates money). Notes and coin are a small part of the money people hold: in August 2026, 10.2% (number 1a: where it comes from) in the United States, 9.2% (number 2a: where it comes from) in the euro area and 3.2% (number 3a: where it comes from) in Britain, on each central bank's broad measure of money (for Britain, notes held by banks included). Real value is made by producing what people want, and prices say how much money it takes to buy it. Over the long run and across countries, faster money growth has moved together with faster inflation, and with faster real growth only weakly or not at all.
- In normal times, a central bank sets an interest rate, not the amount of money the public holds. When it buys bonds from the public, as central banks did on a large scale from 2008 to 2022, it adds to that amount directly, though it still does not set it (what central banks control).
- Real value is made by producing, not by printing. It comes from producing more with the same hours of work, and from trades that leave both sides better off. Across countries and over decades, money growth moved with inflation and little with real growth, in the reading of Lucas and of McCandless and Weber (where real value comes from).
- Prices say how much money it takes to buy real value, and a higher price is not more money. A share that goes from $20 (number 4a: where it comes from) to $40 (number 5a: where it comes from) raises its holder's wealth but creates no money. A bank loan taken against that share does create money. Higher share and house prices can act on shop prices (the prices of the goods and services people buy) only through spending. Whether that spending raises shop prices depends on what the economy can produce (when a share doubles).
- Inflation is a broad fall in what money buys, and it has more than one origin. Each of four origins mattered in some episodes: money growing far faster than output, demand beyond what the economy can produce, supply shocks, and states paying for their spending by creating money. Over whole decades and across countries, money growth moved with inflation most closely when it was fast (money growth and inflation by pace). At the extreme, people get rid of a money as fast as they can: its notes multiply, and all of them together buy less and less (what happens in a hyperinflation).
How banks create and destroy money is the Bank of England's own account. The shares of notes and coin are our own count. The points on prices and on inflation are our judgement, drawn from the sources and the cases that each section names.
The first part of this series asked what gives a money its value. The next part asks what has kept value when money lost it.
This study explains how money works. It is not investment advice, and it makes no forecast.
Most money today is a bank's promise
There are three main kinds of money: notes and coin, bank deposits, and the reserves banks hold in their accounts at the central bank. Notes and reserves are the central bank's promises. Deposits are the promises of commercial banksSource: McLeay, Radia and Thomas 2014a, Bank of England Quarterly Bulletin 2014 Q1, p. 4 (abstract) and p. 7 (opens in a new tab).
Go deeperWhat a banknote's promise to pay means now
A banknote still calls itself a "promise to pay" the bearer. But since the pound left gold in 1931, the Bank of England can repay that promise only with more of its own money, such as another noteSource: McLeay, Radia and Thomas 2014a, pp. 8–9 (opens in a new tab). The first part of this series called this a promise that its issuer never has to keep.
Go deeperThe ladder of promises, down to promises that work almost like money
The promises form a ladder. At the top, within a country, is the central bank's money: notes and reserves. One step down is a bank deposit, which promises to pay in the central bank's money. Each step works the same way. It is a promise to pay in the money of the step aboveSource: Mehrling 2012, 'The Inherent Hierarchy of Money', paper of 25 January 2012, p. 1; listed in the methods' sources (opens in a new tab).
Below deposits come promises that work almost like money. These promises are called near-money. A share in a money-market fund is one of them. Whether near-money counts as money depends on the official measure of money. Each measure draws its own lineSource: Ricks 2016, The Money Problem, p. 17; a book, listed in the methods' sources (opens in a new tab).
A deposit is the bank's promise to pay you, whenever you ask, the same amount in the central bank's money (the state's money). Deposit insurance protects that promise up to a limit (what a bank deposit is). The first part of this series argued that the state's money has a floor (a lower limit to its value), because taxes and debts must be paid in it. We judge that this floor holds for the unit, the state's money. A deposit's claim to that unit holds while its bank is sound or the deposit is insured, and beyond that it depends on what the authorities decide. In Cyprus in 2013, even insured deposits, kept whole, could not be freely drawn: the banks closed for nearly two weeks, then cash withdrawals and transfers were limited for every account, inside Cyprus until May 2014 and for moving money abroad until April 2015Source: European Commission 2019, Ex-Post Evaluation of the Economic Adjustment Programme, Cyprus, 2013-2016, pp. 20, 28-29 (opens in a new tab). At Silicon Valley Bank, depositors beyond the insurance were saved by a decision taken for that bank (what a bank deposit is).
Go deeperWhat the Bank of England says about deposits and notes
In 2014 the Bank of England wrote that bank deposits made up 97% (number 6a: where it comes from) of the money in circulation in BritainSource: McLeay, Radia and Thomas 2014, 'Money creation in the modern economy', Quarterly Bulletin 2014 Q1, p. 15 (opens in a new tab). Its explainer for the public also says that banks create most money when they lend. The explainer puts notes and coins at about 3% (number 7a: where it comes from) of the money in Britain's economySource: Bank of England, explainer 'How is money created?', and its chart of the three types of money (opens in a new tab). That share is not measured like our own count below: the explainer counts banks' reserves as money, and our count leaves reserves out.
In the latest month, notes and coin were about a tenth of the public's money in the United States and the euro area, and less in Britain. Like the Bank of England, our own count for these three economies finds that notes and coin are a small part of the money people hold (notes and coin as a share of the money people hold).
Each central bank counts the broad money that households and firms hold. In the United States, the Federal Reserve (the Fed) calls its count M2, and this study uses M2 mostSource: Federal Reserve, FAQ 'What is the money supply? Is it important?' (opens in a new tab).
Go deeperWhat each central bank's count includes
The European Central Bank (ECB) calls its count M3, and the Bank of England calls its count M4. The Fed's M2 counts notes, checking and other deposits that can be drawn on quickly, small time deposits, and shares in money-market funds sold to individualsSource: Federal Reserve, FAQ 'What is the money supply? Is it important?' (opens in a new tab). The ECB's M3 also counts repurchase agreements, money-market fund shares and bank debt of up to two yearsSource: ECB, 'Monetary aggregates', definitions (opens in a new tab). The Bank of England's M4 counts the private sector's notes, its deposits, and bank debt of up to five yearsSource: Bank of England, 'Further details about M4 data' (opens in a new tab).
Our case studyNotes and coin as a share of the money people holdIn the latest month, notes and coin were 10.2% of broad money in the US, 9.2% in the euro area and 3.2% in Britain, each as its central bank counts it.The US since 1959, the euro area since 1980 and Britain since 1982, with IMF statistics for a wider set of economies
Each central bank defines its own measure of broad money (M2 in the US, M3 in the euro area, M4 in Britain), so the three shares compare forms of money, not economies. US notes and coin include notes held abroad. Without those notes, the share inside the US would be smaller still.
Notes and coin as a share of the money people hold
notes and coin held by the public (in Britain, in circulation), share of broad money, % of broad money; 1959-2026; the US, the euro area and Britain
Notes and coin held by the public (in Britain, all in circulation, banks' holdings included), as a share of each economy's broad money (M2 in the US, M3 in the euro area, M4 in Britain), at the end of each quarter since each series begins.
Data table
| month | economy | share |
|---|---|---|
| 1959-03 | United States (M2) | 9.889 |
| 1959-06 | United States (M2) | 9.827 |
| 1959-09 | United States (M2) | 9.74 |
| 1959-12 | United States (M2) | 9.671 |
| 1960-03 | United States (M2) | 9.622 |
| 1960-06 | United States (M2) | 9.527 |
| 1960-09 | United States (M2) | 9.339 |
| 1960-12 | United States (M2) | 9.187 |
| 1961-03 | United States (M2) | 9.017 |
| 1961-06 | United States (M2) | 8.85 |
| 1961-09 | United States (M2) | 8.801 |
| 1961-12 | United States (M2) | 8.733 |
| 1962-03 | United States (M2) | 8.627 |
| 1962-06 | United States (M2) | 8.531 |
| 1962-09 | United States (M2) | 8.453 |
| 1962-12 | United States (M2) | 8.354 |
| 1963-03 | United States (M2) | 8.282 |
| 1963-06 | United States (M2) | 8.245 |
| 1963-09 | United States (M2) | 8.212 |
| 1963-12 | United States (M2) | 8.189 |
| 1964-03 | United States (M2) | 8.154 |
| 1964-06 | United States (M2) | 8.155 |
| 1964-09 | United States (M2) | 8.059 |
| 1964-12 | United States (M2) | 7.98 |
| 1965-03 | United States (M2) | 7.918 |
| 1965-06 | United States (M2) | 7.885 |
| 1965-09 | United States (M2) | 7.853 |
| 1965-12 | United States (M2) | 7.84 |
| 1966-03 | United States (M2) | 7.812 |
| 1966-06 | United States (M2) | 7.852 |
| 1966-09 | United States (M2) | 7.888 |
| 1966-12 | United States (M2) | 7.913 |
| 1967-03 | United States (M2) | 7.862 |
| 1967-06 | United States (M2) | 7.749 |
| 1967-09 | United States (M2) | 7.655 |
| 1967-12 | United States (M2) | 7.622 |
| 1968-03 | United States (M2) | 7.596 |
| 1968-06 | United States (M2) | 7.63 |
| 1968-09 | United States (M2) | 7.624 |
| 1968-12 | United States (M2) | 7.585 |
| 1969-03 | United States (M2) | 7.591 |
| 1969-06 | United States (M2) | 7.64 |
| 1969-09 | United States (M2) | 7.713 |
| 1969-12 | United States (M2) | 7.773 |
| 1970-03 | United States (M2) | 7.884 |
| 1970-06 | United States (M2) | 7.93 |
| 1970-09 | United States (M2) | 7.837 |
| 1970-12 | United States (M2) | 7.756 |
| 1971-03 | United States (M2) | 7.601 |
| 1971-06 | United States (M2) | 7.489 |
| 1971-09 | United States (M2) | 7.422 |
| 1971-12 | United States (M2) | 7.321 |
| 1972-03 | United States (M2) | 7.226 |
| 1972-06 | United States (M2) | 7.163 |
| 1972-09 | United States (M2) | 7.041 |
| 1972-12 | United States (M2) | 7.005 |
| 1973-03 | United States (M2) | 7.016 |
| 1973-06 | United States (M2) | 7.021 |
| 1973-09 | United States (M2) | 7.101 |
| 1973-12 | United States (M2) | 7.107 |
First 60 of 633 rows. The full table is in the download.
The chart shows each share month by month. In the US, the share has ranged from 6.6% (number 8a: where it comes from) to 11.3% (number 9a: where it comes from) since 1959. In the euro area it has ranged from 4.3% (number 10a: where it comes from) to 9.6% (number 11a: where it comes from) since 1980, and in Britain from 2.5% (number 12a: where it comes from) to 8.1% (number 13a: where it comes from) since 1982. So in none of the three economies have notes and coin come near half of the money people hold since their series began.
The IMF's statistics give a wider view. Across the 163 (number 14a: where it comes from) economies for which the IMF reports both notes and coin and broad money, the median share of notes and coin outside banks was 11.1% (number 15a: where it comes from). The share was half or more in 2 (number 16a: where it comes from) economies: Guinea-Bissau, 65.6% (number 17a: where it comes from), and Iraq, 50.9% (number 18a: where it comes from). Many economies' series stopped years ago, so each economy is read at its own latest month.
Method, data and code for this case study (opens in a new tab)
Broad money leaves out reserves, which only banks hold. Notes and coin, plus banks' reserves, make up base moneySource: Buiter 2007, 'Seigniorage', NBER w12919, pp. 1, 4 (opens in a new tab).
A digital currency issued by a central bank would be base money in another form: a promise from the top of the ladder, held directly by the public.
Banks create money when they lend, within limits
When a bank makes a loan, it credits the borrower's account with a new deposit, and that deposit is new money. The bank does not hand over other savers' depositsSource: McLeay, Radia and Thomas 2014, p. 14 (opens in a new tab). When the borrower repays the loan, the money that the loan created is destroyedSource: McLeay, Radia and Thomas 2014, p. 16 (opens in a new tab).
A bank also creates deposits when it buys an asset, such as a government bond, from someone who is not a bank. The bank destroys deposits when it sells such an assetSource: McLeay, Radia and Thomas 2014, p. 17 (opens in a new tab).
The explorer below shows these steps, and others, on the balance sheets. Choose a step to see what each side holds and owes, and what happens to the two kinds of money, reserves and deposits.
Move the balance sheets: what each step does to money
change on each balance sheet and in the money stock, an example amount; any time; an economy with a central bank and commercial banks
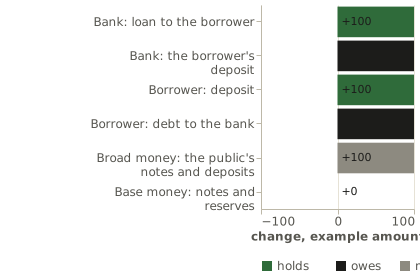
Choose a step: a bank lends, the loan is repaid, cash is withdrawn, the central bank buys a bond from a bank or from a pension fund, the state spends, a share doubles, a share is pledged for a loan. The bars show each change on the balance sheets involved and in broad money and base money.
Data table
| step | line | side | change |
|---|---|---|---|
| A bank lends | Bank: loan to the borrower | holds | 100 |
| A bank lends | Bank: the borrower's deposit | owes | 100 |
| A bank lends | Borrower: deposit | holds | 100 |
| A bank lends | Borrower: debt to the bank | owes | 100 |
| A bank lends | Broad money: the public's notes and deposits | money stock | 100 |
| A bank lends | Base money: notes and reserves | money stock | 0 |
| The loan is repaid | Bank: loan to the borrower | holds | -100 |
| The loan is repaid | Bank: the borrower's deposit | owes | -100 |
| The loan is repaid | Borrower: deposit | holds | -100 |
| The loan is repaid | Borrower: debt to the bank | owes | -100 |
| The loan is repaid | Broad money: the public's notes and deposits | money stock | -100 |
| The loan is repaid | Base money: notes and reserves | money stock | 0 |
| Cash is withdrawn | You: deposit | holds | -100 |
| Cash is withdrawn | You: notes | holds | 100 |
| Cash is withdrawn | Bank: your deposit | owes | -100 |
| Cash is withdrawn | Bank: reserves | holds | -100 |
| Cash is withdrawn | Central bank: reserves | owes | -100 |
| Cash is withdrawn | Central bank: notes | owes | 100 |
| Cash is withdrawn | Broad money: the public's notes and deposits | money stock | 0 |
| Cash is withdrawn | Base money: notes and reserves | money stock | 0 |
| Central bank buys from a bank | Central bank: bond | holds | 100 |
| Central bank buys from a bank | Central bank: reserves | owes | 100 |
| Central bank buys from a bank | Bank: bond | holds | -100 |
| Central bank buys from a bank | Bank: reserves | holds | 100 |
| Central bank buys from a bank | Broad money: the public's notes and deposits | money stock | 0 |
| Central bank buys from a bank | Base money: notes and reserves | money stock | 100 |
| Central bank buys from a fund | Central bank: bond | holds | 100 |
| Central bank buys from a fund | Central bank: reserves | owes | 100 |
| Central bank buys from a fund | Bank: reserves | holds | 100 |
| Central bank buys from a fund | Bank: the fund's deposit | owes | 100 |
| Central bank buys from a fund | Pension fund: bond | holds | -100 |
| Central bank buys from a fund | Pension fund: deposit | holds | 100 |
| Central bank buys from a fund | Broad money: the public's notes and deposits | money stock | 100 |
| Central bank buys from a fund | Base money: notes and reserves | money stock | 100 |
| The state spends | State: account at the central bank | holds | -100 |
| The state spends | Central bank: the state's account | owes | -100 |
| The state spends | Central bank: reserves | owes | 100 |
| The state spends | Bank: reserves | holds | 100 |
| The state spends | Bank: the recipient's deposit | owes | 100 |
| The state spends | Recipient: deposit | holds | 100 |
| The state spends | Broad money: the public's notes and deposits | money stock | 100 |
| The state spends | Base money: notes and reserves | money stock | 100 |
| A share doubles | Holder: share (from 20 to 40) | holds | 20 |
| A share doubles | Company: equity at market value | owes | 20 |
| A share doubles | Broad money: the public's notes and deposits | money stock | 0 |
| A share doubles | Base money: notes and reserves | money stock | 0 |
| A share is pledged | Bank: loan to the holder | holds | 20 |
| A share is pledged | Bank: the holder's deposit | owes | 20 |
| A share is pledged | Holder: deposit | holds | 20 |
| A share is pledged | Holder: debt to the bank | owes | 20 |
| A share is pledged | Broad money: the public's notes and deposits | money stock | 20 |
| A share is pledged | Base money: notes and reserves | money stock | 0 |
But banks cannot create as much money as they like: three things limit them, and reserves are not one of them. The Bank of England names the three: each bank's own business (its profit, the risks it takes and the rules it must follow), what the public does with the new money (for example, using it to repay loans), and the central bank's interest rateSource: McLeay, Radia and Thomas 2014, p. 17 (opens in a new tab). Reserves are not a limit: in normal times, the central bank supplies them to banks on demand, at its interest rate. And adding reserves did not, by itself, make it easier for banks to lendSource: McLeay, Radia and Thomas 2014, p. 16 (opens in a new tab).
Go deeperIf a bank creates the money it lends, why does it want your deposits?
If a bank creates the deposits it lends, why does it want your deposits? Because the borrower spends the new deposit, and the deposit moves to another bank. Reserves move with it, from the first bank's account at the central bank to the second bank's account. The first bank must replace the reserves it lost, so it competes for deposits through the interest rate it paysSource: McLeay, Radia and Thomas 2014, p. 18; Figure 2, p. 19 (opens in a new tab).
Go deeperCreation or limits: which economists stress
Economists argue over which side to stress: that banks create money, or that limits hold them back. Werner stresses creation. Watching one bank's records as it lent to him, he found that a single bank creates the money it lends "out of nothing"Source: Werner 2014, International Review of Financial Analysis 36, p. 1 (abstract); listed in the methods' sources (opens in a new tab). Schumpeter had said the same of banks in 1911Source: Schumpeter 1934, The Theory of Economic Development (1911), tr. Opie (1934), p. 73; a book, listed in the methods' sources (opens in a new tab). The central banks' account stresses the limits.
The case for limits is older than Werner's test. In 1963 Tobin argued that banks cannot create money without end. The public may not want to hold all the money that banks create, and may prefer other assets instead. Some of the new money is soon used to repay loans, and so is destroyedSource: Tobin 1963, 'Commercial Banks as Creators of Money', Cowles Foundation Discussion Paper 159, typescript pp. 7–9; listed in the methods' sources (opens in a new tab). The Bank of England counts this among its limitsSource: McLeay, Radia and Thomas 2014, p. 17, note 4; p. 20 (opens in a new tab). Jakab and Kumhof answer that one does not have to choose between creation and limits. Banks do create money, but how much they create is settled between banks and their customers, and that amount is finite. They add that Tobin argued in words rather than with a model, and looked at one moment rather than at change over timeSource: Jakab and Kumhof 2015, Bank of England Staff Working Paper 529, pp. 7–8 (opens in a new tab).
We judge that loans create deposits wherever banks lend and a central bank supplies reserves at its interest rate. There are three exceptions: the state's spending, a bank that takes deposits of coin and creates no money through loans, and a central bank buying bonds from the public. The state's spending, not a bank's loan, creates new money (a step in the explorer above). When the state pays from its account at the central bank, banks' reserves rise, and so do the deposits of the people it pays.
A bank may take deposits of coin and create no new money through loans, as the Bank of Amsterdam did at first (the methods tell its story). A central bank may buy bonds from the public (what central banks control).
Go deeperHow taxes and bonds take money back
Money also flows the other way. When people pay taxes, or buy the bonds that the Treasury normally sells to fund the state, money moves into the state's account at the central bank. Money moving into that account removes reserves from the banksSource: Federal Reserve H.4.1, Factors Affecting Reserve Balances, table 1: the Treasury's General Account among the factors absorbing reserve funds (opens in a new tab).
So when taxes, and bonds sold to the public, do not take back the money the state spends, that spending adds money over a year, in our reading. The public here means buyers other than banks and the central bank. This happens chiefly when the central bank or banks pay for the state's deficit (the explorer above).
A deposit is a bank's debt to you
Is your money in the bank lent out, so that it exists twice? A deposit is a record of what the bank owes you. The bank holds loans, securities and reserves against all its deposits taken together. The bank does not keep a set of notes put aside for youSource: McLeay, Radia and Thomas 2014, p. 16 (opens in a new tab).
So your money is not handed to the borrower, and it does not exist twice. Your deposit and the borrower's new deposit are two separate promises that the bank owes, and both are money.
The better the bank's promise is backed, the closer a deposit comes to being as good as notes and coin. With deposit insurance, insured depositors have no reason to take their money out in a hurrySource: Diamond and Dybvig 1983, 'Bank Runs, Deposit Insurance, and Liquidity', Journal of Political Economy, p. 416; listed in the methods' sources (opens in a new tab). But deposit insurance covers a deposit only up to a limit, and most money is deposits. In the United States, the insurance covers up to $250,000 (number 19a: where it comes from) per depositor, for each ownership category, at each insured bankSource: FDIC, 'Understanding Deposit Insurance' (opens in a new tab).
Cyprus shows what uninsured deposits can lose. In March 2013, deposits up to €100,000 (number 20a: where it comes from) were kept whole, while uninsured deposits were used to pay for the rescue. At the Bank of Cyprus, 47.5% (number 21a: where it comes from) of the uninsured deposits were turned into shares in the bank. Limits on moving money out of the country were not fully lifted until April 2015Source: European Commission 2019, Ex-post evaluation of the adjustment programme, Cyprus, Institutional Paper 114, pp. 21, 27, 29 (opens in a new tab). Until then, a euro in a Cypriot bank could not be moved or spent freely abroad, as a euro elsewhere could.
Go deeperSilicon Valley Bank, where all depositors were protected
In March 2023, depositors took more than $40 billion (number 22a: where it comes from) out of Silicon Valley Bank in a single day, and the bank was closed the next morningSource: Federal Reserve Board 2023, Review of the supervision of Silicon Valley Bank, pp. 1, 4, 21, 24 (opens in a new tab). Two days later, the authorities announced that all its depositors, insured or not, would be protectedSource: Treasury, Fed and FDIC 2023, joint statement, March 2023, third paragraph (opens in a new tab). This protection was not made a rule for every bank's deposits.
At the end of 2022, 94% (number 23a: where it comes from) of the deposits of the whole Silicon Valley Bank group were uninsuredSource: Federal Reserve Board 2023, Review of the supervision of Silicon Valley Bank, pp. 1, 4, 21, 24 (opens in a new tab). The authorities also protected all the depositors of Signature Bank, under a similar exception for risks to the whole financial system.
What do central banks control?
Central banks today typically set an interest rate rather than the quantity of reserves, and in normal times they do not fix how much money the public holds either. The Bank of England described central banks' role this way in 2014Source: McLeay, Radia and Thomas 2014, p. 15 (opens in a new tab). Since 2008 they have also changed the quantity of reserves, by buying bonds.
In October 2008 the Fed began paying interest on banks' reserves, to put a lower limit under the market interest rateSource: Federal Reserve Board 2008, press release, October 2008 (opens in a new tab).
What the news calls "printing money" today is mostly central banks buying bonds: quantitative easing. When the central bank buys a bond from a pension fund, it pays the fund's bank with new reserves, and the fund gets a new deposit. So both reserves and deposits rise. When the central bank buys a bond from a bank, only reserves riseSource: McLeay, Radia and Thomas 2014, pp. 24–25 (opens in a new tab). The explorer above shows both steps.
From November 2008 to the end of the Fed's purchases in October 2014, US base money was multiplied by 2.77 (number 24a: where it comes from)Source: Federal Reserve Board, H.6, the monetary base (FRED's BOGMBASE), monthly levels (opens in a new tab). Broad money rose too, but barely faster than before.
Shop prices did not follow base money up after 2008. We judge that three conditions of the purchases explain why: interest rates were near zeroSource: Krugman 1998, 'It's Baaack', Brookings Papers on Economic Activity, p. 141 (opens in a new tab), the purchases answered a collapse in demand, and reserves earned interest. The steady pace of broad money is a sign that these conditions were at work.
Go deeperHow fast broad money grew, and why banks and investors held the extra base money
From November 2008 to October 2014, M2 grew about 6.4% (number 25a: where it comes from) a year, close to its pace of 6.2% (number 26a: where it comes from) a year from 2000 to 2007Source: Federal Reserve Board, H.6, M2 (FRED's M2SL), monthly levels (opens in a new tab).
In Krugman's account, at interest rates near zero, banks and investors see little difference between extra base money and a short-term bond, so they simply hold the extra base moneySource: Krugman 1998, 'It's Baaack', Brookings Papers on Economic Activity, p. 141 (opens in a new tab).
Go deeperJapan, where base money grew while prices fell
Japan's central bank also targeted quantities, and its purchases too were a response to falling prices. It targeted the reserves banks hold with it from 2001 to 2006Source: Bank of Japan 2001, decision of March 2001 (opens in a new tab). It targeted base money from 2013Source: Bank of Japan 2013, April 2013, p. 1 and note 1 (opens in a new tab). By September 2016 the Bank of Japan judged that, despite this large-scale easing, it had not reached its price targetSource: Bank of Japan 2016, Comprehensive Assessment, September 2016, p. 1 (opens in a new tab). So base money growing while prices were falling cannot by itself show what base money does to prices.
In 2022, US broad money shrank even though banks lent more. M2 changed by -1.0% (number 27a: where it comes from) over the year, its first fall over twelve months since the series began in 1959Source: Federal Reserve Board, H.6, M2 (FRED's M2SL), December 2021 and December 2022 (opens in a new tab). Banks' loans and leases rose by 12% (number 28a: where it comes from) over the same yearSource: Federal Reserve Board, H.8, loans and leases (FRED's TOTLL), weekly levels averaged by month (opens in a new tab).
How could M2 fall while loans grew? We judge that much of the money that left M2 went into US government bonds (Treasury securities). The study names the routes this money took, but does not measure how much money each one moved.
Go deeperHow the money moved that year, and why banks' reserves fell
Banks' holdings of securities fell over the same year, so their total credit rose by 7% (number 29a: where it comes from), less than their loansSource: Federal Reserve Board, H.8, bank credit (FRED's TOTBKCR), weekly levels averaged by month, and securities (INVEST), monthly (opens in a new tab).
That year the Fed put its interest rate up from MarchSource: FOMC 2022, statement, March 2022 (opens in a new tab). From June, it also began shrinking its holdings of bondsSource: FOMC 2022, statement, May 2022 (opens in a new tab).
Money went into government bonds in two ways. First, banks raised the interest they paid on deposits more slowly than the Fed raised its rate, and deposits flowed outSource: Federal Reserve Bank of New York 2023, Open Market Operations during 2022, p. 28, Box 2 (opens in a new tab). Second, the Fed shrank its own holdings of these bonds, so, in our reading, the public held more of them, and paid for them with money that left M2.
Earlier work had found the same: when the Fed raises its rate, deposits flow out of the banks and into bondsSource: Drechsler, Savov and Schnabl, 'The Deposits Channel of Monetary Policy', NBER w22152, p. 2 (opens in a new tab). Households and nonprofits did hold more Treasury securities: the Fed's accounts estimate their holdings at $0.60 trillion (number 30a: where it comes from) at the end of 2021 and $1.59 trillion (number 31a: where it comes from) a year laterSource: Federal Reserve Z.1, Financial Accounts, table L.210, line 13 (opens in a new tab).
One more change of 2022 moved banks' reserves rather than, by itself, M2. Money-market funds and other lenders that are not banks lent more money to the Fed itself, through loans the Fed calls reverse repos. Most of the year's fall in banks' reserves came from this lendingSource: Federal Reserve Bank of New York 2023, Open Market Operations during 2022, p. 29 and the table of counterparties (opens in a new tab). Banks' reserves are not part of M2, but households' shares in money-market funds areSource: Federal Reserve H.6, Money Stock Measures, the notes on M2 (opens in a new tab).
Go deeperHow the Fed tried steering by the quantity of money
Steering by the quantity of money was tried and dropped. The Fed put the quantity of money first in October 1979Source: FOMC 1979, Record of Policy Actions, October 1979, PDF p. 5 (opens in a new tab). In October 1982 the Fed gave much less weight to M1 (a measure of money narrower than M2)Source: FOMC 1982, Record of Policy Actions, October 1982, p. 12 (opens in a new tab). In 1993 its chairman said that M2 had been downgraded as a guideSource: Greenspan 1993, testimony, July 1993, p. 10 (opens in a new tab).
Did money grow out of barter?
The familiar story says that money grew out of barter. People exchanged goods directly, found it awkward, and settled on one good that everyone would acceptSource: Graeber 2011, Debt, ch. 2, p. 29; a book, listed in the methods' sources (opens in a new tab). But anthropologists who looked for an economy run on barter, or for a money that grew out of barter, found neither. Barter appears between strangers, or where money has failedSource: Humphrey 1985, 'Barter and Economic Disintegration', Man 20(1), p. 48; listed in the methods' sources (opens in a new tab).
Go deeperWhat people used when money failed: cigarettes in a prison camp, cheques in Ireland
Where money failed, substitutes appeared. In a prisoner-of-war camp, cigarettes became the currencySource: Radford 1945, 'The Economic Organisation of a P.O.W. Camp', Economica 12, pp. 190–191; listed in the methods' sources (opens in a new tab).
When Ireland's banks shut from May to November 1970, people could not use their bank accounts, which made up 85% (number 32a: where it comes from) of the country's M2. People went on paying each other with cheques that no bank could clear until the banks reopened, and these cheques carried most paymentsSource: Murphy 1978, 'Money in an Economy Without Banks: The Case of Ireland', Manchester School 46, pp. 41, 43; listed in the methods' sources (opens in a new tab).
The banks that shut were Ireland's four main banks, the ones that cleared the country's cheques. Some merchant and North American banks stayed open, but by the end of May most of them refused new accounts. What kept the cheques moving was what people knew about each other. Shopkeepers and pub owners knew their customers, and gave them goods and cash against cheques that no bank could yet pay. Pubs and shops took the place of the banks: in Murphy's words, they "emerged as a substitute banking system". Cheques drawn on the state or on well-known firms passed from person to person many times, and a stranger's cheque was taken less readily. When the banks reopened on the 17th of November 1970, the cheques written during the closure and not yet cleared came to £5 billion (number 33a: where it comes from)Source: Murphy 1978, 'Money in an Economy Without Banks: The Case of Ireland', Manchester School 46, pp. 41-45; listed in the methods' sources (opens in a new tab).
Coins came late. In Mesopotamia the basic unit was the silver shekel. It was a weight of silver, set equal to a fixed measure of barley. Temples recorded debts in silver, and peasants paid them mostly in barleySource: Graeber 2011, Debt, p. 39; a book, listed in the methods' sources (opens in a new tab). The first coins were made in the seventh century BC in western Asia Minor, in today's Turkey, probably in LydiaSource: Head 1911, Historia Numorum, 2nd ed., 'Lydia', pp. 643–645 (opens in a new tab).
We conclude that no record shows money growing out of barter: in the earliest records, money is a unit for counting debts, long before coins existed. To say that money began as credit goes one step further, and is less sure: it is the reading of one school, Innes's and Graeber's, not settled history.
In 1913 Innes set out the view that money is credit. On this view, a seller who hands over goods for money receives a claim on someone, so the money one person holds is a debt that someone else owesSource: Innes 1913, 'What Is Money?', Banking Law Journal 30(5), pp. 391, 402 (opens in a new tab).
If money is created all the time, why is everyone not rich?
Money is a claim on real value, so creating money does not make everyone rich. Real value is made by producing more. Adam Smith saw ten workers in a small pin factory make about 48,000 (number 34a: where it comes from) pins a day by dividing the work between them. Each worker alone could hardly have made twentySource: Smith 1776, Wealth of Nations, Book I, ch. 1, pp. 6–7 (Bohn's edition, 1921) (opens in a new tab). US output per hour of work in business outside farming is 5.4 (number 35a: where it comes from) times its level of 1947Source: BLS, output per hour, nonfarm business (PRS85006093; FRED's OPHNFB), the first and the latest quarter (opens in a new tab).
The national accounts count what a firm produces, minus what it bought from other firms, as value addedSource: BEA, glossary, 'Value added' (opens in a new tab).
Exchange also makes real value, even when nothing new is produced. In a prisoner-of-war camp that Radford described, every prisoner received the same parcels, yet trading the contents made each prisoner better offSource: Radford 1945, Economica 12, p. 189; listed in the methods' sources (opens in a new tab).
Go deeperWhy water is cheap and diamonds are dear
Price and real value differ in another way: a thing's price is not its usefulness. Smith contrasted water, which is very useful and nearly free, with diamonds, which are of little use yet buy a great dealSource: Smith 1776, Book I, ch. 4, pp. 28–29 (opens in a new tab). Economics' answer is that a price follows how much people value one more unit of a thingSource: Jevons 1879, The Theory of Political Economy, 2nd ed., p. 86 (opens in a new tab). Where a thing is abundant, like water, one more unit is worth little.
What does more money do to real value over the long run? Across 110 (number 36a: where it comes from) countries over 1960–1990, money growth and inflation moved together, with a correlation of 0.95 (number 37a: where it comes from). A correlation of one would mean they moved in perfect step. A second comparison, of money growth with real growth, uses a different and slightly smaller set: about a hundred countries in the IMF's data. Across those hundred or so countries, Lucas read no link between money growth and real growthSource: Lucas 1996, Nobel lecture, 'Monetary Neutrality', p. 249; Figures 1 and 2, p. 250; note 2 (opens in a new tab). Among the rich economies of the OECD (the Organisation for Economic Co-operation and Development), the link between money growth and real growth was positive, but weakSource: McCandless and Weber 1995, 'Some Monetary Facts', abstract (opens in a new tab). That weak link is not evidence that more money makes more output. We drew the same picture with our own decades (money growth and real growth, decade by decade).
Our case studyMoney growth and real growth, decade by decadeThe chart draws 580 decades from 152 economies, real growth against money growth, as Lucas drew them: a picture of his finding, not a test of it.Decades from 1960 to 2020, from IMF, World Bank, FRED and ECB series
Each point on the chart is one economy over one decade: its average growth of broad money against its average real growth. The finding is Lucas's and McCandless and Weber's. The chart only shows what the decades look like.
Money growth and real growth, decade by decade
average yearly growth of broad money and of real GDP over ten years, % a year; 1960-2020; a grid of economies
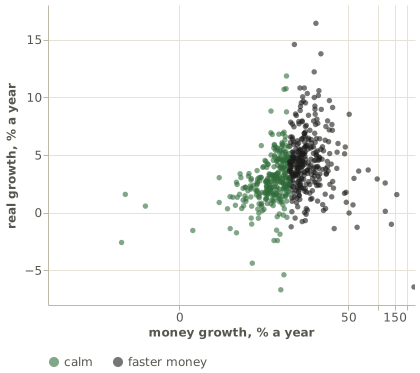
Each point is one economy's decade: its broad money growth (a log-like scale) against its real output growth, both averages over ten years; calm decades are those in which money grew no faster than the line the text describes, adapted from Teles and Uhlig.
Data table
| economy | window | money | real | kind |
|---|---|---|---|---|
| AE | 2010-2020 | 6.47 | 2.69 | calm |
| AF | 2010-2020 | 8.08 | 2.95 | calm |
| AG | 2000-2010 | 5.39 | 1.41 | calm |
| AG | 2010-2020 | 1.55 | 3.03 | calm |
| AI | 1990-2000 | 12.45 | 3.92 | faster money |
| AI | 2000-2010 | 8.83 | 3.39 | calm |
| AI | 2010-2020 | -2.79 | -2.59 | calm |
| AL | 2000-2010 | 10.95 | 5.28 | calm |
| AL | 2010-2020 | 3.96 | 1.89 | calm |
| AM | 2000-2010 | 17.93 | 9.51 | faster money |
| AM | 2010-2020 | 13.05 | 6.38 | faster money |
| AO | 2000-2010 | 51.24 | 8.52 | faster money |
| AO | 2010-2020 | 15.57 | 1.15 | faster money |
| AU | 1960-1970 | 7.52 | 5.0 | calm |
| AU | 1970-1980 | 12.45 | 2.88 | faster money |
| AU | 1980-1990 | 13.9 | 3.18 | faster money |
| AU | 1990-2000 | 7.15 | 3.37 | calm |
| AU | 2000-2010 | 10.95 | 3.03 | calm |
| AU | 2010-2020 | 7.31 | 2.12 | calm |
| AW | 1990-2000 | 8.26 | 4.94 | calm |
| AW | 2000-2010 | 5.96 | 0.17 | calm |
| AZ | 2000-2010 | 26.09 | 13.77 | faster money |
| AZ | 2010-2020 | 10.2 | 0.68 | calm |
| BA | 2010-2020 | 7.29 | 1.77 | calm |
| BB | 1970-1980 | 14.73 | 6.23 | faster money |
| BB | 1980-1990 | 9.86 | 0.93 | calm |
| BB | 1990-2000 | 6.61 | 1.18 | calm |
| BD | 1990-2000 | 12.57 | 4.69 | faster money |
| BD | 2000-2010 | 17.48 | 5.59 | faster money |
| BD | 2010-2020 | 13.63 | 14.57 | faster money |
| BF | 1970-1980 | 17.38 | 3.25 | faster money |
| BF | 1980-1990 | 10.59 | 3.46 | calm |
| BF | 1990-2000 | 9.39 | 5.18 | calm |
| BF | 2000-2010 | 12.17 | 5.76 | faster money |
| BF | 2010-2020 | 13.16 | 5.23 | faster money |
| BG | 2000-2010 | 16.63 | 4.48 | faster money |
| BG | 2010-2020 | 8.06 | 1.52 | calm |
| BH | 1970-1980 | 22.97 | 7.64 | faster money |
| BH | 1980-1990 | 5.05 | 1.54 | calm |
| BH | 1990-2000 | 8.4 | 5.4 | calm |
| BH | 2000-2010 | 12.94 | 5.26 | faster money |
| BI | 1970-1980 | 14.87 | 2.66 | faster money |
| BI | 1980-1990 | 11.32 | 4.36 | calm |
| BI | 1990-2000 | 12.59 | -1.23 | faster money |
| BI | 2000-2010 | 18.69 | 3.65 | faster money |
| BI | 2010-2020 | 13.53 | 1.69 | faster money |
| BJ | 2000-2010 | 10.29 | 3.8 | calm |
| BJ | 2010-2020 | 8.26 | 4.82 | calm |
| BN | 2000-2010 | 3.49 | 0.59 | calm |
| BN | 2010-2020 | 2.09 | 0.33 | calm |
| BO | 1960-1970 | 14.82 | 5.35 | faster money |
| BO | 1970-1980 | 24.92 | 3.83 | faster money |
| BO | 1980-1990 | 120.04 | 0.12 | faster money |
| BO | 1990-2000 | 19.7 | 3.7 | faster money |
| BO | 2000-2010 | 12.0 | 3.77 | faster money |
| BO | 2010-2020 | 10.28 | 3.22 | calm |
| BR | 1980-1990 | 156.96 | 1.56 | faster money |
| BR | 1990-2000 | 119.75 | 2.57 | faster money |
| BR | 2000-2010 | 14.28 | 3.62 | faster money |
| BR | 2010-2020 | 10.58 | 0.33 | calm |
First 60 of 580 rows. The full table is in the download.
Method, data and code for this case study (opens in a new tab)
Go deeperWhy the rich economies show a weak link
We read the weak link among the rich economies as the lending mechanism above at work. A growing economy that borrows more also holds more deposits, since loans create deposits. We do not test this reading.
Go deeperWhen more money can bring more output
We judge that whether more money brings more output depends on what the economy can still produce. One recent study finds that when a central bank makes money scarce, output can suffer for a decade or more, while money made plentiful does little to raise itSource: Jordà, Singh and Taylor, 'The Long-Run Effects of Monetary Policy', NBER w26666, pp. 3, 38 (opens in a new tab).
Credit can finance new production. In Schumpeter's account, bank credit gives the entrepreneur new buying power. With it, the entrepreneur can pay more for workers, materials and machines than the firms that use them now pay. That bidding raises prices until the new goods come to marketSource: Schumpeter 1934, The Theory of Economic Development, ch. 3, pp. 107, 109–110, 113–114; a book, listed in the methods' sources (opens in a new tab).
We judge that new production paid for by credit raises output once the new goods arrive. Before they arrive, if resources are already fully used, prices rise. Where resources lie idle, output can rise first.
In the United States from 1959 to 2025, M2 grew a little faster than real output and prices combined (money, real output and prices in the US since 1959).
Our case studyMoney, real output and prices in the US since 1959From 1959 to 2025, US M2 grew 6.5% a year on average, real output 3.0% and prices 3.2%. How often each dollar was spent fell slowly.The United States, 1959–2025, FRED
The chart shows, decade by decade, how fast money, real output and prices grew, and M2's velocity. One equation ties the four together. Money growth plus the growth of velocity equals real growth plus price growth. Over the whole period, money grew a little faster than real output and prices combined. So, by the equation, velocity fell: each dollar of M2 was spent a little less often in a year at the end of the period than at its start. The equation holds by definition, so it shows only how the four grew side by side.
Along the way, velocity rose until 1997, fell to a low in 2020, and has partly recovered sinceSource: FRED, M2V, quarterly: FRED's own calculation (nominal GDP over M2), which no agency publishes (opens in a new tab).
Money, real output and prices in the US
average yearly growth of M2, real GDP, the GDP price index and velocity, % a year; 1959-2025; the United States
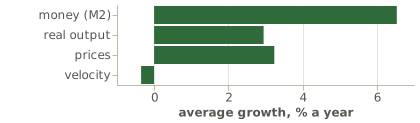
Average yearly growth, fourth quarter to fourth quarter, of US M2, real output (real GDP), the GDP price index and velocity (GDP over M2), for 1959 to 2025 and each decade.
Data table
| span | series | growth |
|---|---|---|
| 1959-2025 | money (M2) | 6.54 |
| 1959-2025 | real output | 2.95 |
| 1959-2025 | prices | 3.24 |
| 1959-2025 | velocity | -0.35 |
| 1959-1969 | money (M2) | 6.78 |
| 1959-1969 | real output | 4.34 |
| 1959-1969 | prices | 2.41 |
| 1959-1969 | velocity | -0.03 |
| 1969-1979 | money (M2) | 9.18 |
| 1969-1979 | real output | 3.21 |
| 1969-1979 | prices | 6.44 |
| 1969-1979 | velocity | 0.46 |
| 1979-1989 | money (M2) | 7.59 |
| 1979-1989 | real output | 3.06 |
| 1979-1989 | prices | 4.41 |
| 1979-1989 | velocity | -0.13 |
| 1989-1999 | money (M2) | 3.87 |
| 1989-1999 | real output | 3.3 |
| 1989-1999 | prices | 2.14 |
| 1989-1999 | velocity | 1.57 |
| 1999-2009 | money (M2) | 6.12 |
| 1999-2009 | real output | 1.77 |
| 1999-2009 | prices | 2.15 |
| 1999-2009 | velocity | -2.2 |
| 2009-2019 | money (M2) | 5.86 |
| 2009-2019 | real output | 2.4 |
| 2009-2019 | prices | 1.63 |
| 2009-2019 | velocity | -1.82 |
| 2019-2025 | money (M2) | 6.3 |
| 2019-2025 | real output | 2.32 |
| 2019-2025 | prices | 3.69 |
| 2019-2025 | velocity | -0.28 |
Method, data and code for this case study (opens in a new tab)
In John Law's France, did printing notes to keep a share price high protect the money?
One episode tested three of John Law's beliefs at once. This section follows one of them, which Law put into practice: that new money could keep the price of the shares in his company highSource: Velde 2003, 'Government Equity and Money: John Law's System in 1720 France', Chicago Fed WP 2003-31, p. 1 (opens in a new tab).
In 1719 and 1720 his bank printed notes to buy shares in his company. In March 1720 the bank fixed the share price, buying shares for its notes at that price. From January to August 1720, the money in circulation multiplied about 2.6 (number 38a: where it comes from) times. Yet prices in Paris rose only 19% (number 39a: where it comes from) from the end of January to August. The notes lost their value against silver instead. By the end of 1720 the notes had ceased to be money, and the shares had fallen with themSource: Velde 2003, 'Government Equity and Money: John Law's System in 1720 France', Chicago Fed WP 2003-31, pp. 18, 25, 27, 30, 33–34, 44 (opens in a new tab).
Printing new notes to keep a share price high did not protect the money: even though prices in Paris rose far less than the amount of money, the notes lost their value against silver.
Go deeperLaw's two other beliefs, and how they fared
One belief was that more money would raise trade and work rather than prices, where people were out of work and resources lay unused. In Law's words, "Domestic trade depends on the money. A greater quantity employs more people than a lesser quantity"Source: Murphy 1997, John Law, Economic Theorist and Policy-Maker, pp. 63, 88–89, quoting Law's Money and Trade Considered (1705); a book, listed in the methods' sources (opens in a new tab). The other was that in France the state's debt could be exchanged for shares in his company, which collected the taxes.
On trade and work, in Murphy's account, France's real economy grew considerably, but it could not keep pace with the notes and sharesSource: Murphy 1997, p. 244; a book, listed in the methods' sources (opens in a new tab). On the state's debt, turning it into shares and notes ended with the notes no longer money, and the debt turned back into bondsSource: Velde 2003, p. 1 (opens in a new tab).
When a share doubles, is money made?
Your shares go from $20 (number 4b: where it comes from) to $40 (number 5b: where it comes from). A share that doubles creates no money: on the balance sheets we use throughout this study, its higher price changes no deposit and no note. The holder's wealth rises, and that rise is a holding gain. When a share is sold between buyers and sellers that are not banks, money that already exists moves from the buyer to the seller. If the buyer borrowed to pay, the new money was made by the loan, not by the higher price. The explorer above shows both steps: the share doubling, and the share pledged for a loan.
A crash destroys wealth, not money. And if someone borrowed against shares before a crash, that loan must still be repaid, even though the shares are now worth less.
Our own case study splits the rise in US households' wealth since 1952 by where it came from (where US households' real wealth came from). Holding gains on real assets and shares, after inflation, and net investment added to that wealth.
Our case studyWhere US households' real wealth came fromFrom 1952 to 2025, US households' real net worth rose $166.5 trillion, with $79.9 trillion of it from real holding gains on real assets and shares.US households and nonprofits, 1952–2025, quarterly, the Fed's Z.1
From 1952 to 2025 the parts add up as follows, in trillions of December 2025 dollars. Parts that lowered real net worth have a minus sign.
Table, 8 rowsWhat changed households' real net worth, 1952–2025
| What changed households' real net worth, 1952–2025 | |
|---|---|
| Real assets, shares and other holdings with a market price: holding gain or loss, after inflation | $79.9 trillion (number 44a: where it comes from) |
| Net investment | $98.2 trillion (number 45a: where it comes from) |
| Gain from inflation on what households owe | $23.4 trillion (number 46a: where it comes from) |
| Other changes in what households hold | $9.3 trillion (number 47a: where it comes from) |
| Fund and pension claims: holding gain or loss, after inflation | $-15.8 trillion (number 48a: where it comes from) |
| Deposits, bonds, notes and coin: holding gain or loss, after inflation | $-23.2 trillion (number 49a: where it comes from) |
| Other assets fixed in dollars: loss to inflation | $-5.2 trillion (number 50a: where it comes from) |
| The real change in net worth | $166.5 trillion (number 51a: where it comes from) |
Inflation cost households on their deposits, bonds, notes and coin, and other assets fixed in dollars. It also made their debts smaller, and that gain equalled about 82% (number 52a: where it comes from) of the cost. Fund and pension claims, whose values move partly with markets, are counted apart. We call none of the parts the main one.
Three rows are losses before interest. They are the rows for fund and pension claims, for deposits, bonds, notes and coin, and for other assets fixed in dollars. The interest households earned on bonds and deposits is not in them: it reaches net worth through what they saved and invested. So, in our reading, these rows are not net losses to savers.
Where US households' real wealth came from, by decade
the real change in net worth and its parts, trillions of December 2025 dollars; 1952-2025; US households and nonprofits
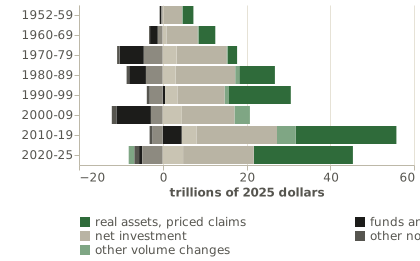
For each decade from 1952, the real change in US households' net worth split into real holding gains on three groups of assets, the Fed's net investment, inflation's erosion of other nominal assets, inflation's gain on what households owe, and other volume changes, in December 2025 dollars. The parts add up to the real change.
Data table
| decade | part | trillions |
|---|---|---|
| 1952-59 | real assets, priced claims | 2.534 |
| 1952-59 | funds and pensions | -0.364 |
| 1952-59 | bonds, notes and coin, deposits | -0.293 |
| 1952-59 | net investment | 4.428 |
| 1952-59 | other nominal assets | -0.092 |
| 1952-59 | gain on what is owed | 0.192 |
| 1952-59 | other volume changes | 0.187 |
| 1960-69 | real assets, priced claims | 3.925 |
| 1960-69 | funds and pensions | -1.857 |
| 1960-69 | bonds, notes and coin, deposits | -1.159 |
| 1960-69 | net investment | 7.509 |
| 1960-69 | other nominal assets | -0.238 |
| 1960-69 | gain on what is owed | 0.877 |
| 1960-69 | other volume changes | 0.257 |
| 1970-79 | real assets, priced claims | 2.198 |
| 1970-79 | funds and pensions | -5.762 |
| 1970-79 | bonds, notes and coin, deposits | -4.514 |
| 1970-79 | net investment | 11.981 |
| 1970-79 | other nominal assets | -0.619 |
| 1970-79 | gain on what is owed | 3.338 |
| 1970-79 | other volume changes | 0.246 |
| 1980-89 | real assets, priced claims | 8.511 |
| 1980-89 | funds and pensions | -4.003 |
| 1980-89 | bonds, notes and coin, deposits | -3.993 |
| 1980-89 | net investment | 14.214 |
| 1980-89 | other nominal assets | -0.634 |
| 1980-89 | gain on what is owed | 3.123 |
| 1980-89 | other volume changes | 0.958 |
| 1990-99 | real assets, priced claims | 14.913 |
| 1990-99 | funds and pensions | 0.584 |
| 1990-99 | bonds, notes and coin, deposits | -3.072 |
| 1990-99 | net investment | 11.315 |
| 1990-99 | other nominal assets | -0.715 |
| 1990-99 | gain on what is owed | 2.936 |
| 1990-99 | other volume changes | 0.862 |
| 2000-09 | real assets, priced claims | 0.043 |
| 2000-09 | funds and pensions | -8.244 |
| 2000-09 | bonds, notes and coin, deposits | -2.821 |
| 2000-09 | net investment | 12.631 |
| 2000-09 | other nominal assets | -1.091 |
| 2000-09 | gain on what is owed | 4.569 |
| 2000-09 | other volume changes | 3.634 |
| 2010-19 | real assets, priced claims | 24.073 |
| 2010-19 | funds and pensions | 4.562 |
| 2010-19 | bonds, notes and coin, deposits | -2.456 |
| 2010-19 | net investment | 19.257 |
| 2010-19 | other nominal assets | -0.681 |
| 2010-19 | gain on what is owed | 3.477 |
| 2010-19 | other volume changes | 4.45 |
| 2020-25 | real assets, priced claims | 23.685 |
| 2020-25 | funds and pensions | -0.734 |
| 2020-25 | bonds, notes and coin, deposits | -4.898 |
| 2020-25 | net investment | 16.868 |
| 2020-25 | other nominal assets | -1.15 |
| 2020-25 | gain on what is owed | 4.883 |
| 2020-25 | other volume changes | -1.332 |
A crash shows the same accounting from the other side. In 2022, the value after inflation of the shares and other stakes in firms held by euro-area households changed by -9.3% (number 53a: where it comes from), and that of US households' by -18.4% (number 54a: where it comes from). These were holding losses: wealth disappeared, but no money was destroyed.
Method, data and code for this case study (opens in a new tab)
Go deeperWhen a state turned a higher gold price into a payment
One way a change in price did create money was when a state turned the higher price into a payment. In 1934 the US government took the Federal Reserve's gold and paid for it with credits at the Treasury. The government then cut the amount of gold a dollar stood for, so the same gold was worth more dollars. The government counted that rise in the gold's dollar value as income for itself, and put $2 billion (number 55a: where it comes from) of that income into a fund for trading gold and currencies. Money appeared where these acts made a payment, not from the higher price itselfSource: Gold Reserve Act 1934, 48 Stat. 337, sec. 2(a), p. 337; sec. 7 and sec. 10, pp. 341–342 (opens in a new tab).
Do rising share and house prices raise shop prices?
A rise in share prices reaches spending through people who feel richer. One study estimates that each extra dollar of wealth held in shares adds about 3.2 cents (number 56a: where it comes from) a year to spendingSource: Chodorow-Reich, Nenov and Simsek, 'Stock Market Wealth and the Real Economy', NBER w25959, abstract; pp. 1, 45 (opens in a new tab).
The same study estimates that a 20% (number 57a: where it comes from) rise in share prices raises the total of wages paid in the economy by at least 1.7% (number 58a: where it comes from) two years later. That holds unless the central bank acts to counter the rise in share prices.
A rise in asset prices also reaches spending through loans taken against assets that are now worth more, and those loans do create money. In the US housing boom, existing homeowners borrowed 25 (number 59a: where it comes from) to 30 cents (number 60a: where it comes from) for every dollar of rise in their home equity (the value of their home minus what they owe on it). That borrowing came to about 2.8% (number 61a: where it comes from) of GDP a year from 2002 to 2006Source: Mian and Sufi, 'House Prices, Home Equity-Based Borrowing, and the U.S. Household Leverage Crisis', NBER w15283, pp. 3, 4, 24 (opens in a new tab).
Measures of shop prices largely leave asset prices outSource: BLS, 'Measuring Price Change in the CPI: Rent and Rental Equivalence', Table A (opens in a new tab).
Go deeperHow the US consumer price index counts homes
The US consumer price index does not include the price of homes. Instead, for people who own their home, it counts the rent they would pay if they rented that same home. This imagined rent makes up 26% (number 62a: where it comes from) of the goods and services whose prices the index followsSource: BLS, 'Measuring Price Change in the CPI: Rent and Rental Equivalence', Table A (opens in a new tab).
So a rise in share and house prices can raise shop prices only through spending, and we judge that whether that spending raises shop prices depends on what the economy can still produce and on how the central bank responds.
Where does inflation come from?
Coffee costs more: is coffee worth more, or is money worth less? Inflation is a broad, lasting fall in what money buys. In the cases we read, inflation came from four origins that overlap, and each one dominated somewhere: money growing far faster than output, demand beyond what the economy can produce, supply shocks, and states paying for their spending by creating money.
None of them explains every episode, and they are not of the same rank. A state paying for its spending with new money is a cause behind two of the others: it works through money growing far faster than output, and through demand. But money has also grown fast for other reasons, as when American silver reached Spain. And Barro and Bianchi explain the inflation after 2020 largely by government budgets, and the amount of money plays no part in their account.
For money growing far faster than output, the case is Spain in the sixteenth century: as large amounts of American silver reached Spain, prices rose with itSource: Hamilton 1934, American Treasure and the Price Revolution in Spain, p. 301; a book, listed in the methods' sources (opens in a new tab).
Go deeperHow the silver and the rise in prices are read
Hamilton found that the silver and Spain's prices moved closely together, and judged the silver to be the main reason for Spain's long rise in pricesSource: Hamilton 1934, American Treasure and the Price Revolution in Spain, p. 301; a book, listed in the methods' sources (opens in a new tab). Whether the silver was also behind the long rise in prices across Europe is argued overSource: von Glahn 1996, Fountain of Fortune, p. 234; a book, listed in the methods' sources (opens in a new tab). For Europe, the main alternative view holds that a growing population, pressing on scarce land, lay behind the riseSource: von Glahn 1996, Fountain of Fortune, p. 234; a book, listed in the methods' sources (opens in a new tab).
For a supply shock, the textbook case is the oil shock of 1973–1974. But one study finds that oil explains only part of that decade's inflationSource: Blanchard and Galí 2007, NBER w13368, pp. 2–3 (opens in a new tab). Another argues that commodity prices had already risen in a boom fed by moneySource: Barsky and Kilian 2001, NBER w8389, abstract; p. 2 (opens in a new tab). So one inflation can have two origins at once: a supply shock arriving during a boom fed by money. The sources disagree on how much each mattered.
For demand beyond what the economy can produce, the case is the US inflation of 2021, a mixed one. Blanchard and Bernanke find that the inflation largely reflected strong demand, but that most of the surge came through price shocks: commodity prices, which reflected that demand and other forces, the war in Ukraine among them from 2022, and price spikes in goods whose supply could not keep up. Tight labour markets added little at first, but their effect lasts longerSource: Blanchard and Bernanke 2023, 'What Caused the US Pandemic-Era Inflation?', NBER w31417, abstract; pp. 34, 38-39 (opens in a new tab).
In the same years, in the euro area, inflation was mostly imported, above all through energySource: Blanchard and Bernanke 2024, 'An Analysis of Pandemic-Era Inflation in 11 Economies', NBER w32532, pp. 29, 31 (opens in a new tab).
For a state paying for its spending by creating money, the case is Argentina. It shows that when a state stops paying for its spending with money from its central bank, inflation can come down fast. Argentina's monthly inflation was 12.8% (number 63a: where it comes from) in November 2023, before a new government took office in December. It rose higher still in December and January; on the 13th of December, the official exchange rate went from 366 (number 64a: where it comes from) to 800 (number 65a: where it comes from) pesos per dollarSource: BCRA, Communication A 3500, the reference exchange rate, 12 and 13 December 2023 (opens in a new tab). By May 2024 monthly inflation had fallen to 4.2% (number 66a: where it comes from)Source: INDEC, consumer prices by division, national level, monthly and twelve-month changes (opens in a new tab). Inflation fell once the state had balanced its budget and the Treasury had stopped borrowing directly from the central bankSource: BCRA 2026, Informe de Política Monetaria, June 2026, p. 3; pp. 43–44, Recuadro 4 (opens in a new tab). The central bank names two other steps that helped: some prices that had been held at the wrong level, compared with other prices, were corrected, and from July 2024 the central bank repaired its own balance sheet. The central bank does not say which of these steps did the mostSource: BCRA 2026, Informe de Política Monetaria, June 2026, p. 3; pp. 43–44, Recuadro 4 (opens in a new tab). The first part of this series told the extreme of this story: hyperinflations, in which inflation destroyed a money.
How closely did money growth move with inflation? The link depends on how high inflation is. The Bank for International Settlements (BIS) found the link about one for one when inflation is high, and nearly absent when inflation is lowSource: Borio, Hofmann and Zakrajšek 2023, BIS Bulletin 67, p. 1; p. 3, note 5 (opens in a new tab). Our own decades show a similar split: where money grew slowly, the link was weaker than where it grew fast, but it did not disappear (money growth and inflation by pace).
Go deeperWhy the link looks weaker when inflation is low
The first part of this series found the same in De Grauwe and Polan's work.
Teles and Uhlig add that at low inflation, the link fits the data much better once two other things are allowed for: output growth, and the cost of holding moneySource: Teles and Uhlig, 'Is Quantity Theory Still Alive?', NBER w16393, abstract (opens in a new tab). The cost of holding money is the interest people give up by holding money rather than an asset that pays interest.
How often did fast money growth come with high inflation? The faster base money grew, the more often a decade had inflation averaging 20% (number 67a: where it comes from) a year or more. We counted our own decades: ten-year periods in 155 (number 68a: where it comes from) economies, from 1950 to 2020.
Table, 4 rowsBase money growth, a year, as a yearly percentage
| Base money growth, a year, as a yearly percentage | Decades with such inflation |
|---|---|
| No faster than about 13% (number 69a: where it comes from) | 0 (number 70a: where it comes from) of 309 (number 71a: where it comes from) |
| Faster, up to about 22% (number 72a: where it comes from) | 7 (number 73a: where it comes from) of 203 (number 74a: where it comes from) |
| Faster, up to about 35% (number 75a: where it comes from) | 17 (number 76a: where it comes from) of 78 (number 77a: where it comes from) |
| Faster still | 38 (number 78a: where it comes from) of 45 (number 79a: where it comes from) |
The first edge is the line that the case on money growth and inflation by pace calls 12% (number 80a: where it comes from) a year; both are measured in log points, and as a yearly percentage that line is about 13% (number 69b: where it comes from). Six moneys whose unit changed, Venezuela's and Zimbabwe's among them, are not in the count. Nor are most of today's euro members before the euro. Money and prices are measured over the same decade, as in the case on money growth and inflation by pace, so this is a count of the past, not a forecast or a threshold.
Our case studyMoney growth and inflation by paceWhere base money grew faster than 12% a year, each extra point went with about one more point of inflation (1.07); below that pace, with 0.25 of a point.Decades from 1950 to 2020, from IMF, World Bank, FRED and ECB series
Each point on the chart is one economy over one decade: its average growth of base money against its average inflation. The fast side's figure rests mostly on the fastest decades, and most of those fell between 1970 and 2000. Broad money shows the same split between fast and slow decades.
How much inflation went with each point of money growth
slope of ten-year inflation on ten-year money growth, each side of the line, points of inflation per point of money growth; 1950-2020; a grid of economies
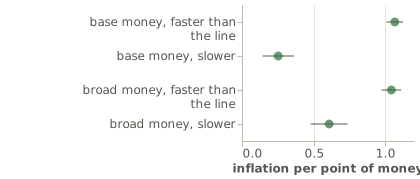
How much average inflation went with each point of average money growth across decades, for decades in which money grew faster than the line (adapted from Teles and Uhlig) and for those in which it grew slower, for base money and for broad money, each with its 95% margin of error.
Data table
| row | slope | low | high |
|---|---|---|---|
| base money, faster than the line | 1.0664 | 1.0079 | 1.1248 |
| base money, slower | 0.2531 | 0.1431 | 0.3631 |
| broad money, faster than the line | 1.0427 | 0.9742 | 1.1112 |
| broad money, slower | 0.6082 | 0.4792 | 0.7373 |
This is an association across decades. Errors in measuring money growth make the link on the slow side look somewhat weaker than it is. We judge that such errors explain part of the gap between the two sides, but not all of it.
Method, data and code for this case study (opens in a new tab)
In calm decades, each point of base money growth went with less inflation than each point of broad money growth (base against broad money in calm decades).
Our case studyBase against broad money in calm decadesIn calm decades, each point of base money growth went with 0.12 of a point of inflation, and each point of broad money growth with 0.39. The gap was 0.27.Calm decades from 1960 to 2020, from the same series
Calm decades are those in which both base money and broad money grew by 12% (number 80b: where it comes from) a year or less. They are fewer than the slow decades above, and this comparison also allows for real growth, so its figure for base money differs from the slow decades' figure. Errors in measuring base money could explain the whole gap only if they were very large. The methods give the size they would need.
Method, data and code for this case study (opens in a new tab)
How much the money itself added to the inflation of 2021–2023 is disputed. The BIS found that broad money growth in 2020 beyond the growth of real output went with later inflation, but said little about causeSource: Borio, Hofmann and Zakrajšek 2023, pp. 4–5 (opens in a new tab). Our own comparison across economies finds the same association and the same limit (money growth in 2020–2021 and inflation in 2022–2023).
Barro and Bianchi read the inflation surge, in OECD economies, as driven largely by government budgetsSource: Barro and Bianchi, 'Fiscal Influences on Inflation in OECD Countries, 2020–2023', NBER w31838, abstract (opens in a new tab). In their reading, unexpected inflation shrank what government debts were worth, and that shrinking covered about four-fifths of governments' extra spendingSource: Barro and Bianchi, 'Fiscal Influences on Inflation in OECD Countries, 2020–2023', NBER w31838, abstract (opens in a new tab).
Our case studyMoney growth in 2020–2021 and inflation in 2022–2023Where inflation was calm in 2015–2019, each point of broad money growth in 2020–2021 went with 0.27 of a point more inflation in 2022–2023, or 0.10 allowing for 2021's inflation.Economies with calm inflation in 2015–2019, IMF statistics, money growth over 2019–2021 and inflation over 2021–2023
Across 76 (number 81a: where it comes from) economies, each extra point of money growth went with 0.27 (number 82a: where it comes from) of a point more inflation. The margin of error on that figure runs from 0.10 (number 83a: where it comes from) to 0.48 (number 84a: where it comes from). We count a link as large enough to matter from a tenth of a point of inflation for each point of money growth.
Leaving out any one economy, or one monetary union as a whole, never makes the link vanish. But in some of these tests, the margin of error reaches below a tenth of a point. So in these tests the link stays above zero, but it may be too small to matter. Most other ways of making the comparison give the same warning.
When 2021's own inflation is taken into account, the link falls to 0.10 (number 85a: where it comes from), and it may be zero. If there is a link, it is smaller than 0.33 (number 86a: where it comes from). Part of 2021's inflation may itself have come from money growth in 2020–2021. If so, allowing for 2021's inflation takes out part of the money's own effect, and this figure and its upper limit may be smaller than the true ones.
Money growth and the government spending that carried it went together, and this comparison cannot separate them.
Money growth in 2020-21 and inflation in 2022-23
robust slope of 2022-23 inflation on 2020-21 broad money growth, points of inflation per point of money growth; 2019-2023; economies that started calm
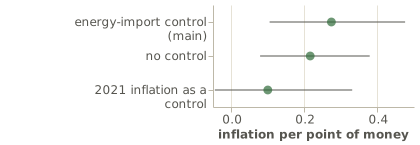
Across economies whose inflation was calm in 2015-19, how much their inflation over 2022-23 went with each point of their broad money growth over 2020-21, by a method that a few extreme economies cannot distort, in three versions set before we saw the results, each with its 95% margin of error from resampling the economies.
Data table
| row | slope | low | high | economies |
|---|---|---|---|---|
| energy-import control (main) | 0.274 | 0.105 | 0.476 | 76 |
| no control | 0.216 | 0.079 | 0.379 | 112 |
| 2021 inflation as a control | 0.1 | -0.045 | 0.331 | 76 |
Method, data and code for this case study (opens in a new tab)
We read these sources as saying that in the United States the inflation largely reflected strong demand, but that most of it came through price shocks from commodities and shortages, and that tight labour markets kept it going for longer. Across economies, money growth went together with the government spending that carried it, so neither can be credited alone.
What happens in a hyperinflation?
In a hyperinflation, the number of notes soars, and what the notes buy collapses even faster. In Cagan's account, the faster people expect prices to rise, the less they want to hold in money. What counts is what that money can buy, not its number of notes. As a result, prices rise faster than the number of notes grows, and real balances shrinkSource: Walsh 2010, Monetary Theory and Policy, ch. 4, on Cagan; a book, listed in the methods' sources (opens in a new tab). Hungary's pengő holds the record, in July 1946. Prices then rose about 207% (number 87a: where it comes from) a day, so they doubled every 15 hours (number 88a: where it comes from)Source: Hanke and Krus 2013, 'World Hyperinflations', p. 8; listed in the methods' sources (opens in a new tab).
Hungary's hyperinflation ended in July 1946, and on the 1st of August 1946 the forint replaced the pengőSource: Magyar Nemzeti Bank, 'History', the post-war section (opens in a new tab).
A hyperinflation is a lot of money and little real value at once. The first part of this series tells what stands behind such a collapse: a state paying for its spending by creating money.
Who gains and who pays when money is created?
The state gains from issuing money. That gain is called seigniorage. In this section, the word means the profit that a central bank hands over to the state. A central bank earns interest on its bonds. It pays interest on banks' reserves, but nothing on its notes. When the central bank earns more than it pays, it hands the difference to the stateSource: Buiter 2007, 'Seigniorage', NBER w12919, p. 3 (opens in a new tab).
Go deeperThe two senses of seigniorage
The word has two senses. The first part of this series used it for the new money a state issues to pay for its spending. This section uses the other sense.
In the autumn of 2022, the Fed's earnings fell short of what it had to pay, including the interest on banks' reserves, and the Fed stopped paying the stateSource: Federal Reserve Banks 2023, Combined Financial Statements 2023, Notes 3 and 12 (opens in a new tab).
Go deeperWhat the Fed paid the state before, and how large the shortfall has grown
The Fed paid $54.9 billion (number 89a: where it comes from) to the state in 2019Source: Federal Reserve Banks 2019, Combined Financial Statements 2019, Statements of Operations, p. 4 (opens in a new tab). The shortfall stood at $16.6 billion (number 90a: where it comes from) at the end of 2022Source: Federal Reserve Banks 2023, Combined Financial Statements 2023, Notes 3 and 12 (opens in a new tab). The Fed will pay the state nothing more until its profits have made up the shortfall. At the end of 2025, the shortfall stood at $243 billion (number 91a: where it comes from)Source: Federal Reserve Banks 2025, Combined Financial Statements 2025, Statements of Condition (opens in a new tab).
Inflation shrinks what the central bank's notes and reserves can buy. Their holders lose as if they paid a tax, and that loss is called the inflation taxSource: Buiter 2007, 'Seigniorage', NBER w12919, pp. 1, 4 (opens in a new tab). Reserves now earn interest close to the central bank's policy rate, and notes earn none. So we judge that, once that interest is counted, the inflation tax falls mainly on whoever holds notes.
Unexpected inflation also moves wealth from lenders to borrowers, because it shrinks what debts at fixed rates are worthSource: Doepke and Schneider 2006, 'Inflation as a Redistribution Shock', NBER w12319, p. 1 (opens in a new tab). Banks gain too: when the policy rate rises, banks widen the gap between what they earn and what they pay on depositsSource: Drechsler, Savov and Schnabl, 'The Deposits Channel of Monetary Policy', NBER w22152, pp. 2, 8 (opens in a new tab).
Go deeperWho would gain and who would lose, in one estimate
Doepke and Schneider estimated this for the United States, for an unexpected inflation of five points a year lasting ten years from 1989. Rich, old households would lose the most, because they are the main holders of bonds. Young middle-class households with fixed-rate mortgages would gain. The government is a borrower too, and would gain, in all, 5.2% (number 92a: where it comes from) to 13% (number 93a: where it comes from) of GDPSource: Doepke and Schneider 2006, 'Inflation and the Redistribution of Nominal Wealth', Journal of Political Economy 114(6), pp. 1069, 1071; listed in the methods' sources (opens in a new tab).
When a central bank's purchases raise the prices of other assets, the holders of those assets gain as well. The Bank of England judged that its purchases pushed up share prices by at least as much as the prices of the government bonds it boughtSource: Bank of England 2012, 'The Distributional Effects of Asset Purchases', p. 1 (opens in a new tab).
The Bank of England also found that households' wealth in such assets is very unequally spread: the richest 5% (number 94a: where it comes from) of households hold 40% (number 95a: where it comes from) of the assets that households hold outside pension fundsSource: Bank of England 2012, 'The Distributional Effects of Asset Purchases', p. 1 (opens in a new tab).
We conclude that the transfers that come with creating money move wealth between people rather than make real value. The state gains through its central bank. Holders of notes pay most of the inflation tax. Borrowers at fixed rates gain from lenders. Banks gain on their deposits. And holders of financial assets gain when central-bank purchases raise asset prices.
If not central banks' "money printer", what should you watch?
What the news calls the "money printer" is mostly central banks buying bonds (what central banks control). These are the six things we would watch instead. For each, the question is how high is too high. For some of the six, the episodes in this study give a reading, and for others none. None of these readings is a forecast.
- Bank lending and broad money, compared with spending. Most new money comes from a loan. What matters is whether new money grows faster than what people spend and than what the economy can produce. Base money alone told little over a few years: from November 2008 to October 2014, US base money nearly tripled, and shop prices did not follow it up (what central banks control).
- How the state's deficits are financed: by bonds sold to the public, by banks, or by its central bank. In Argentina, monthly inflation was about thirteen per cent in November 2023, before a new government took office. It was higher still in December and January, and about four per cent by May 2024. It fell once the budget was balanced and the Treasury stopped borrowing from the central bank, among other steps (where inflation comes from). The hyperinflations of the first part of this series came with money created for the state. The episodes point to the route, and no size of deficit in them marked the point at which inflation began.
- Whom a central bank buys from. Buying from banks adds reserves. Buying from the public adds deposits too. The episodes give no level for this item.
- The central bank's interest rate, compared with inflation. In normal times, this interest rate is the tool a central bank uses. The first part of this series tells of one case: Turkey, which cut its interest rate below inflation from 2021.
- Whether output can still rise. Where resources lie idle, more spending can raise output first. Where resources are fully used, more spending raises prices. No measure of unused resources in these episodes marked the turn.
- What assets earn when their prices rise, compared with the price paid for them and with interest rates. A share that rises creates no money, but a loan taken against it does. No level of prices against earnings in these episodes marked a turn.
Go deeperWhat past episodes showed for these items
On bank lending and broad money: over whole decades, money growth went with inflation most closely when it was fast (money growth and inflation by pace).
Where base money grew faster than about twelve per cent a year, each extra point of its growth went with about one more point of inflation. Where it grew more slowly, each point went with about a quarter of a point (money growth and inflation by pace). After the pandemic, across economies, each extra point of broad money growth in 2020–2021 went with about a quarter of a point more inflation in 2022–2023, and perhaps none once 2021's own inflation is allowed for (money growth in 2020–2021 and inflation in 2022–2023).
On whether output can still rise: after 2008, when demand had collapsed, extra base money did little to prices (what central banks control). In 2021, strong demand met shortages, and prices rose (where inflation comes from).
On asset prices: from 2002 to 2006, US homeowners borrowed against the rising value of their homes, about three per cent of GDP a year (rising share and house prices).
Go deeperTwo signs of what kind of inflation is under way
Two signs in the data show what kind of inflation is under way, and whether it will last. The first is how prices and quantities move. A supply shock moves them in opposite directions: prices rise while the quantity sold falls. A demand shock moves them in the same direction. On that test, Fed economists find that supply pushed US goods prices up and then down in 2021–2023, and that demand did the same, but laterSource: Braun, Flaaen and Hacıoğlu Hoke 2024, 'Supply vs Demand Factors Influencing Prices of Manufactured Goods', FEDS Notes, February 2024 (opens in a new tab). Shapiro applies the test to each category of consumer spending, month by month, and so splits inflation into a part driven by supply and a part driven by demand. He writes that policymakers and practitioners can use this split to see what drives inflation as it happensSource: Shapiro 2024, 'Decomposing Supply and Demand Driven Inflation', FRBSF WP 2022-18, revised February 2024, abstract and p. 2; listed in the methods' sources (opens in a new tab). The second sign is what people expect inflation to be, which is a sign of whether a surge in inflation will last. Blanchard and Bernanke find that in 2021–2023, expectations of inflation over the long run stayed stable. They also find little sign of wages and prices pushing each other upSource: Blanchard and Bernanke 2023, 'What Caused the US Pandemic-Era Inflation?', NBER w31417, pp. 28, 39 (opens in a new tab).
Where did the United States stand on these in the latest data? M2 grew a little slower than spending in dollars, and bank loans a little fasterSource: Federal Reserve Board and BEA, M2 and loans and leases (H.6, H.8) and nominal GDP (BEA), latest observations (opens in a new tab). The Fed's policy rate stood a little above inflation. The table gives each figure as the latest one available, so the periods differ slightly.
Table, 7 rowsThe latest US figures
| The latest US figures | Period | |
|---|---|---|
| Growth of M2 | 5.7% (number 96a: where it comes from) | the twelve months to August 2026 |
| Growth of banks' loans and leases | 7.7% (number 97a: where it comes from) | the twelve months to September 2026 |
| Growth of spending in dollars (nominal GDP) | 6.3% (number 98a: where it comes from) | the four quarters to mid-2026 |
| The Fed's policy rate | 3.63% (number 99a: where it comes from) | August 2026 |
| Consumer-price inflation | 3.4% (number 100a: where it comes from) | the twelve months to August 2026 |
| The federal deficit, as a share of GDP | 5.8% (number 101a: where it comes from) | fiscal year 2025 |
| Rise in the Fed's holdings of Treasury securities | 8.5% (number 102a: where it comes from) | the year to September 2026 |
M2 and loans come from the Federal Reserve BoardSource: Federal Reserve Board, H.6 and H.8, M2 and loans and leases, latest observations (opens in a new tab), and spending from the BEASource: BEA, nominal GDP, NIPA table 1.1.5, latest quarter (opens in a new tab). The policy rate comes from the BoardSource: Federal Reserve Board, H.15, the effective federal funds rate, monthly (opens in a new tab), and inflation from the BLSSource: BLS, CPI-U, all items, seasonally adjusted (CUSR0000SA0) (opens in a new tab). The deficit comes from FRED, which draws it from the Office of Management and BudgetSource: FRED, FYFSGDA188S (opens in a new tab). The Fed's holdings of Treasury securities rose over the yearSource: Federal Reserve Board, H.4.1, securities held outright, Treasury securities, weekly (opens in a new tab). They rose because, from December 2025, the Fed bought Treasury bills to keep banks' reserves plentifulSource: FOMC 2025, statement of 10 December 2025 (opens in a new tab). Two items have no single reading: whether output can still rise, and how share prices compare with earnings and interest rates. These are readings of the data, not a forecast.
The first part of this series asked what gives a money its value. The next part asks what has kept value when money lost it.
The studies behind this answer
7
- Notes and coin as a share of the money people holdIn the latest month, notes and coin were 10.2% (number 1b: where it comes from) of broad money in the US, 9.2% (number 2b: where it comes from) in the euro area and 3.2% (number 3b: where it comes from) in Britain, each as its central bank counts it.The US since 1959, the euro area since 1980 and Britain since 1982, with IMF statistics for a wider set of economies
- Money growth and real growth, decade by decadeThe chart draws 580 (number 103a: where it comes from) decades from 152 (number 104a: where it comes from) economies, real growth against money growth, as Lucas drew them: a picture of his finding, not a test of it.Decades from 1960 to 2020, from IMF, World Bank, FRED and ECB series
- Money, real output and prices in the US since 1959From 1959 to 2025, US M2 grew 6.5% (number 105a: where it comes from) a year on average, real output 3.0% (number 106a: where it comes from) and prices 3.2% (number 107a: where it comes from). How often each dollar was spent fell slowly.The United States, 1959–2025, FRED
- Where US households' real wealth came fromFrom 1952 to 2025, US households' real net worth rose $166.5 trillion (number 51b: where it comes from), with $79.9 trillion (number 44b: where it comes from) of it from real holding gains on real assets and shares.US households and nonprofits, 1952–2025, quarterly, the Fed's Z.1
- Money growth and inflation by paceWhere base money grew faster than 12% (number 80c: where it comes from) a year, each extra point went with about one more point of inflation (1.07 (number 108a: where it comes from)); below that pace, with 0.25 (number 109a: where it comes from) of a point.Decades from 1950 to 2020, from IMF, World Bank, FRED and ECB series
- Base against broad money in calm decadesIn calm decades, each point of base money growth went with 0.12 (number 110a: where it comes from) of a point of inflation, and each point of broad money growth with 0.39 (number 111a: where it comes from). The gap was 0.27 (number 112a: where it comes from).Calm decades from 1960 to 2020, from the same series
- Money growth in 2020–2021 and inflation in 2022–2023Where inflation was calm in 2015–2019, each point of broad money growth in 2020–2021 went with 0.27 (number 82b: where it comes from) of a point more inflation in 2022–2023, or 0.10 (number 85b: where it comes from) allowing for 2021's inflation.Economies with calm inflation in 2015–2019, IMF statistics, money growth over 2019–2021 and inflation over 2021–2023
Get next week's study by email
One email a week with the new study, a few days before it is on LinkedIn.
Help shape the next studiesTwo minutes, anonymous: tell us what worked, or suggest a study
Terms
23
- supply shock
- A sudden change in what an economy can produce, such as a jump in the price of oil, that raises prices while the quantity sold falls. Example: When oil producers cut their supply, fuel prices jumped while less fuel was sold.
- near-money
- A short-term promise to pay money, such as a share in a money-market fund: close to money, counted as money by some statistics and not by others. Example: A share in a money-market fund is paid out in deposits on demand, so many treat it as money; the US M2 counts the retail ones.
- money-market fund
- A fund that holds very short-term debt and whose shares can be turned into deposits on demand, so its shares are close to money. Example: Idle cash in a brokerage account is often placed in a money-market fund, from which it can be withdrawn the next day.
- broad money
- The money the public holds: notes and coin plus bank deposits, and some near-monies, as each statistic defines it (M2 in the US, M3 in the euro area, M4 in Britain). Example: Your current account and the notes in your wallet are both broad money; the reserves your bank holds at the central bank are not.
- repurchase agreement
- A sale of a security with a promise to buy it back soon at a set price: in effect, a short loan with the security as its pledge. Example: A firm lends spare cash to a bank overnight: the bank sells it a government bond today and buys it back tomorrow for slightly more.
- base money
- Notes and coin, which the central bank issues and, for coin, the state, plus the reserves banks hold in their accounts at the central bank. Example: When the central bank buys a bond from a bank, it pays with new reserves: base money rises, and the public's money does not change.
- deposit
- The balance in a bank account: a record of what the bank owes its customer, payable in central-bank money on demand. Example: When a bank lends you the price of a car, it writes that sum into your account: a new deposit, which you can spend.
- reserves
- Money banks hold in their accounts at the central bank, used to settle payments between banks. Only banks hold them. Example: When you pay someone at another bank, your bank sends reserves to theirs through their accounts at the central bank.
- quantitative easing
- A central bank buying bonds on a large scale, paying with new reserves. Bought from the public rather than from banks, it creates deposits too. Example: From 2008 the Fed bought government bonds and mortgage bonds by the trillion, paying with reserves it created.
- reverse repo
- Here, a short loan to the central bank, often overnight: the lender hands over money, takes a bond as pledge, and is repaid with interest. Example: A money-market fund cannot hold reserves at the Fed, but it can lend the Fed money overnight through a reverse repo.
- real value
- Goods and services people want, and the means to make them; what money is a claim on, measured by what money buys rather than by its amount. Example: A bakery that bakes more bread with the same flour and hours has made more real value; printing more notes has not.
- value added
- What a firm produces less what it bought from other firms: the national accounts' measure of value made. Example: A baker who sells bread for more than the flour, power and rent cost adds the difference to the economy's output.
- velocity
- How many times, in a year, the money stock pays for the economy's output: output in money terms divided by the money stock. Example: If the money stock is a third of a year's output, each unit pays for output about three times a year.
- holding gain
- A rise in the price of something held: it raises its holder's wealth, but no money is created by it. Example: A house bought for one price and now worth more is a holding gain until it is sold: wealth, not money.
- net investment
- What households added to their wealth by acquiring homes, firms and financial assets, less their new borrowing and the wear on what they own, as the Fed's accounts count it. Example: A family that pays from its income for an extension to its house adds to net investment.
- real net worth
- What households own minus what they owe, measured after inflation. Example: A household with no debt whose assets rise in a year exactly as fast as prices has the same real net worth.
- hyperinflation
- Prices rising so fast that people get rid of the money as fast as they can. Example: In Hungary in July 1946, prices doubled in less than a day.
- margin of error
- The range within which the true figure probably lies, given the noise in the data. Example: A survey puts a party a little ahead, but its margin of error runs from a narrow loss to a clear win.
- monetary union
- Several countries sharing one money and one central bank. Example: The euro area is a monetary union: its countries share the euro and the European Central Bank.
- real balances
- The money people hold measured by what it buys: the amount of money divided by a price index. Example: If the notes in circulation double while prices quadruple, real balances halve: all the notes together buy half as much.
- seigniorage
- What a state gains from issuing money, counted two ways: as the new money it issues, or as the interest a central bank earns on assets bought with money that pays little or nothing. Example: A state that pays its bills with new notes takes seigniorage in the first sense; a central bank earning interest on bonds bought with its notes takes it in the second.
- inflation tax
- What inflation takes from the real value of central-bank money, notes and reserves; with reserves now earning interest, we read its net weight as falling chiefly on notes. Example: If prices rise by a tenth in a year, the notes you held all year buy a tenth less: that loss is the inflation tax.
- policy rate
- The interest rate a central bank sets for its own money, which other short-term rates follow. Example: When the Fed raises its policy rate, banks soon pay and charge more on short loans.
Where the numbers come from
112
The answer in brief
- 10.2% % of M2, notes and coin held by the public, share of M2, 2026-08, the United States In the text: 1a 1bFirst Thing, computed (opens in a new tab). As of 10 October 2026. How it is computed (opens in a new tab).
- 9.2% % of M3, notes and coin held by the public, share of M3, 2026-08, the euro area In the text: 2a 2bFirst Thing, computed (opens in a new tab). As of 10 October 2026. How it is computed (opens in a new tab).
- 3.2% % of M4, notes and coin in circulation, banks' holdings included, share of M4, 2026-08, Britain In the text: 3a 3bFirst Thing, computed (opens in a new tab). As of 10 October 2026. How it is computed (opens in a new tab).
Most money today is a bank's promise
- 6.6% % of M2, lowest monthly share of notes and coin in M2, 1959-01 to 2026-08 (1986-12), the United States In the text: 8aFirst Thing, computed (opens in a new tab). As of 10 October 2026. How it is computed (opens in a new tab).
- 11.3% % of M2, highest monthly share of notes and coin in M2, 1959-01 to 2026-08 (2018-11), the United States In the text: 9aFirst Thing, computed (opens in a new tab). As of 10 October 2026. How it is computed (opens in a new tab).
- 4.3% % of M3, lowest monthly share of notes and coin in M3, 1980-01 to 2026-08 (2001-12), the euro area In the text: 10aFirst Thing, computed (opens in a new tab). As of 10 October 2026. How it is computed (opens in a new tab).
- 9.6% % of M3, highest monthly share of notes and coin in M3, 1980-01 to 2026-08 (2022-03), the euro area In the text: 11aFirst Thing, computed (opens in a new tab). As of 10 October 2026. How it is computed (opens in a new tab).
- 2.5% % of M4, lowest monthly share of notes and coin in M4, 1982-06 to 2026-08 (2010-02), Britain In the text: 12aFirst Thing, computed (opens in a new tab). As of 10 October 2026. How it is computed (opens in a new tab).
- 8.1% % of M4, highest monthly share of notes and coin in M4, 1982-06 to 2026-08 (1982-06), Britain In the text: 13aFirst Thing, computed (opens in a new tab). As of 10 October 2026. How it is computed (opens in a new tab).
- 163 economies, economies with both IMF lines, each economy's latest month, IMF IFS economies with both lines In the text: 14aFirst Thing, computed (opens in a new tab). As of 10 October 2026. How it is computed (opens in a new tab).
- 11.1% % of money and quasi-money, median share of currency outside banks, each economy's latest month, IMF IFS economies with both lines In the text: 15aFirst Thing, computed (opens in a new tab). As of 10 October 2026. How it is computed (opens in a new tab).
- 2 economies, economies where currency is half or more, each economy's latest month, IMF IFS economies with both lines In the text: 16aFirst Thing, computed (opens in a new tab). As of 10 October 2026. How it is computed (opens in a new tab).
- 65.6% % of money and quasi-money, currency outside banks, share of money and quasi-money (IMF), 2016-05, Guinea-Bissau In the text: 17aFirst Thing, computed (opens in a new tab). As of 10 October 2026. How it is computed (opens in a new tab).
- 50.9% % of money and quasi-money, currency outside banks, share of money and quasi-money (IMF), 2009-02, Iraq In the text: 18aFirst Thing, computed (opens in a new tab). As of 10 October 2026. How it is computed (opens in a new tab).
A deposit is a bank's debt to you
- $250,000 dollars per depositor, per insured bank, per ownership category, the standard maximum deposit insurance amount, from 2010, the United States In the text: 19a12 U.S.C. §1821(a)(1)(E), 2023 edition (opens in a new tab). As of 1 January 2023.
- €100,000 euros per depositor, the insured deposits preserved without a levy, March 2013, Cyprus's banks In the text: 20aEuropean Commission, Ex-Post Evaluation of the Economic Adjustment Programme, Cyprus, 2013-2016 (Institutional Paper 114) (opens in a new tab). As of 1 October 2019.
- 47.5% % of uninsured deposits converted into shares, the Bank of Cyprus's uninsured deposits bailed in, March 2013, the Bank of Cyprus In the text: 21aEuropean Commission, Ex-Post Evaluation of the Economic Adjustment Programme, Cyprus, 2013-2016 (Institutional Paper 114) (opens in a new tab). As of 1 October 2019.
- $40 billion billions of dollars of deposits lost in a day (more than), deposits withdrawn from Silicon Valley Bank, 9 March 2023, Silicon Valley Bank In the text: 22aFederal Reserve Board, Review of the Federal Reserve's Supervision and Regulation of Silicon Valley Bank (April 2023) (opens in a new tab). As of 28 April 2023.
- 94% % of deposits uninsured, share of the group's deposits that were uninsured, end of 2022, SVB Financial Group In the text: 23aFederal Reserve Board, Review of the Federal Reserve's Supervision and Regulation of Silicon Valley Bank (April 2023) (opens in a new tab). As of 28 April 2023.
What do central banks control?
- 2.77 times, US monetary base, end over start (Fed purchases), 2008-11 to 2014-10, the United States In the text: 24aFirst Thing, computed (opens in a new tab). As of 30 September 2026. How it is computed (opens in a new tab).
- 6.4% % a year, US M2, average growth a year, 2008-11 to 2014-10, the United States In the text: 25aFirst Thing, computed (opens in a new tab). As of 30 September 2026. How it is computed (opens in a new tab).
- 6.2% % a year, US M2, average growth a year, 2000-12 to 2007-12, the United States In the text: 26aFirst Thing, computed (opens in a new tab). As of 30 September 2026. How it is computed (opens in a new tab).
- -1.0%, change in US M2, seasonally adjusted, December 2021 to December 2022, the United States In the text: 27aFirst Thing, computed (opens in a new tab). As of 30 September 2026. How it is computed (opens in a new tab).
- 12%, change in US banks' loans and leases, December 2021 to December 2022, US commercial banks In the text: 28aFirst Thing, computed (opens in a new tab). As of 10 October 2026. How it is computed (opens in a new tab).
- 7%, change in US banks' total credit, loans and securities, December 2021 to December 2022, US commercial banks In the text: 29aFirst Thing, computed (opens in a new tab). As of 12 October 2026. How it is computed (opens in a new tab).
- $0.60 trillion trillions of dollars, market value, US households' and nonprofits' holdings of Treasury securities, end of 2021, the United States In the text: 30aFederal Reserve, Financial Accounts of the United States (Z.1), table L.210, release of 9 March 2023 (opens in a new tab). As of 9 March 2023.
- $1.59 trillion trillions of dollars, market value, US households' and nonprofits' holdings of Treasury securities, end of 2022, the United States In the text: 31aFederal Reserve, Financial Accounts of the United States (Z.1), table L.210, release of 9 March 2023 (opens in a new tab). As of 9 March 2023.
Did money grow out of barter?
- £5 billion billions of Irish pounds of uncleared cheques, the uncleared cheques at the end of the bank closure, November 1970, Ireland In the text: 33aMurphy 1978, Manchester School 46(1) (opens in a new tab). As of 1 March 1978.
If money is created all the time, why is everyone not rich?
- 48,000 pins a day, the pins ten workers made in a day, 1776, the small manufactory Smith saw In the text: 34aSmith, Wealth of Nations, Book I, ch. 1 (Bohn's Standard Library, 1921) (opens in a new tab). As of 9 March 1776.
- 5.4 times, US nonfarm business output per hour, latest over first, 1947Q1 to 2026Q2, the United States In the text: 35aFirst Thing, computed (opens in a new tab). As of 10 October 2026. How it is computed (opens in a new tab).
- 110 countries, the countries in McCandless and Weber's plot, 1960-1990, McCandless and Weber's countries In the text: 36aLucas 1996, Nobel lecture, Monetary Neutrality (opens in a new tab). As of 1 January 1996.
- 0.95 correlation, the correlation of 30-year average inflation with M2 growth, 1960-1990, 110 countries In the text: 37aLucas 1996, Nobel lecture, Monetary Neutrality (after McCandless and Weber 1995) (opens in a new tab). As of 1 January 1996.
In John Law's France, did printing notes to keep a share price high protect the money?
- 2.6 times, the multiple of the money in circulation (Velde's estimate), 1720, France In the text: 38aVelde 2003, Chicago Fed WP 2003-31 (opens in a new tab). As of 30 November 2003.
- 19% % from January to August 1720, the further rise of prices in Paris to their peak, January to August 1720, Paris In the text: 39aVelde 2003, Chicago Fed WP 2003-31 (opens in a new tab). As of 30 November 2003.
- 9,000 livres livres per share, the price at which the bank bought shares for notes, March 1720, John Law's Company In the text: 40aVelde 2003, Chicago Fed WP 2003-31 (opens in a new tab). As of 30 November 2003.
- 25% % in one month, the rise of prices in Paris (hospital purchases), January 1720, Paris In the text: 43aVelde 2003, Chicago Fed WP 2003-31 (opens in a new tab). As of 30 November 2003.
When a share doubles, is money made?
- $79.9 trillion trillions of Dec-2025 dollars, real assets and market-priced claims, real holding gains, 1952-2025, US households and nonprofits (Z.1) In the text: 44a 44bFirst Thing, computed (opens in a new tab). As of 10 October 2026. How it is computed (opens in a new tab).
- $98.2 trillion trillions of Dec-2025 dollars, net investment (the Fed's line), 1952-2025, US households and nonprofits (Z.1) In the text: 45aFirst Thing, computed (opens in a new tab). As of 10 October 2026. How it is computed (opens in a new tab).
- $23.4 trillion trillions of Dec-2025 dollars, inflation's gain on liabilities, 1952-2025, US households and nonprofits (Z.1) In the text: 46aFirst Thing, computed (opens in a new tab). As of 10 October 2026. How it is computed (opens in a new tab).
- $9.3 trillion trillions of Dec-2025 dollars, other volume changes, 1952-2025, US households and nonprofits (Z.1) In the text: 47aFirst Thing, computed (opens in a new tab). As of 10 October 2026. How it is computed (opens in a new tab).
- $-15.8 trillion trillions of Dec-2025 dollars, fund and pension claims, real holding gains, 1952-2025, US households and nonprofits (Z.1) In the text: 48aFirst Thing, computed (opens in a new tab). As of 10 October 2026. How it is computed (opens in a new tab).
- $-23.2 trillion trillions of Dec-2025 dollars, debt securities, currency and deposits, real holding gains, 1952-2025, US households and nonprofits (Z.1) In the text: 49aFirst Thing, computed (opens in a new tab). As of 10 October 2026. How it is computed (opens in a new tab).
- $-5.2 trillion trillions of Dec-2025 dollars, inflation's erosion of other nominal assets, 1952-2025, US households and nonprofits (Z.1) In the text: 50aFirst Thing, computed (opens in a new tab). As of 10 October 2026. How it is computed (opens in a new tab).
- $166.5 trillion trillions of Dec-2025 dollars, real change in net worth, 1952-2025, US households and nonprofits (Z.1) In the text: 51a 51bFirst Thing, computed (opens in a new tab). As of 10 October 2026. How it is computed (opens in a new tab).
- 82%, inflation's gain on debts over its loss on assets fixed in dollars, 1952-2025, US households and nonprofits In the text: 52aFirst Thing, computed (opens in a new tab). As of 10 October 2026. How it is computed (opens in a new tab).
- -9.3% % of the start-of-year level, real holding gains on equity, 2022, euro-area households (ECB) In the text: 53aFirst Thing, computed (opens in a new tab). As of 10 October 2026. How it is computed (opens in a new tab).
- -18.4% % of the start-of-year level, real holding gains on equity, 2022, US households (Z.1) In the text: 54aFirst Thing, computed (opens in a new tab). As of 10 October 2026. How it is computed (opens in a new tab).
- $2 billion billions of dollars, the sum appropriated to the stabilization fund out of the revaluation's receipts, 1934, the United States In the text: 55aGold Reserve Act of 1934, 48 Stat. 337 (opens in a new tab). As of 30 January 1934.
Do rising share and house prices raise shop prices?
- 3.2 cents cents a year per dollar of stock wealth, the marginal propensity to consume out of stock wealth, 1990s-2010s (their sample), US local labour markets In the text: 56aChodorow-Reich, Nenov and Simsek, NBER w25959 (rev. 2020) (opens in a new tab). As of 1 February 2020.
- 20% % rise in stock valuations, the rise in stock valuations in their example, their example, the United States In the text: 57aChodorow-Reich, Nenov and Simsek, NBER w25959 (rev. 2020) (opens in a new tab). As of 1 February 2020.
- 1.7% % rise in the aggregate labour bill, at least, rise in the total wage bill two years on, unless policy counters it, their example, the United States In the text: 58aChodorow-Reich, Nenov and Simsek, NBER w25959 (rev. 2020) (opens in a new tab). As of 1 February 2020.
- 25 cents per dollar of home equity gained, what the average homeowner extracted per dollar rise in home equity, low end, 2002-2006, US homeowners In the text: 59aMian and Sufi, NBER w15283 (opens in a new tab). As of 1 August 2009.
- 30 cents cents per dollar of home equity gained, what the average homeowner extracted per dollar rise in home equity, high end, 2002-2006, US homeowners In the text: 60aMian and Sufi, NBER w15283 (opens in a new tab). As of 1 August 2009.
- 2.8% % of GDP a year, home equity-based borrowing, 2002-2006, the United States In the text: 61aMian and Sufi, NBER w15283 (opens in a new tab). As of 1 August 2009.
- 26% % of the CPI basket (relative importance), owners' equivalent rent's weight in the CPI, December 2025, the US CPI In the text: 62aBLS, Measuring Price Change in the CPI - Rent and Rental Equivalence (opens in a new tab). As of 13 February 2026.
Where does inflation come from?
- 12.8% % in the month, the monthly rise in consumer prices, November 2023, Argentina In the text: 63aINDEC, consumer prices by division (serie_ipc_divisiones.csv), national level (opens in a new tab). As of 12 October 2026.
- 366 pesos per dollar, the official reference exchange rate, 12 December 2023, Argentina In the text: 64aBCRA, Communication A 3500, reference exchange rate (com3500.xls) (opens in a new tab). As of 12 October 2026.
- 800 pesos per dollar, the official reference exchange rate, 13 December 2023, Argentina In the text: 65aBCRA, Communication A 3500, reference exchange rate (com3500.xls) (opens in a new tab). As of 12 October 2026.
- 4.2% % in the month, the monthly rise in consumer prices, May 2024, Argentina In the text: 66aINDEC, consumer prices by division (serie_ipc_divisiones.csv), national level (opens in a new tab). As of 1 September 2026.
- 20% % a year, inflation line (main), averaged over the decade, 1950-2020, a grid of economies In the text: 67aFirst Thing, computed (opens in a new tab). As of 1 October 2026. How it is computed (opens in a new tab).
- 155 economies, economies counted, 1950-2020, a grid of economies In the text: 68aFirst Thing, computed (opens in a new tab). As of 1 October 2026. How it is computed (opens in a new tab).
- 13% % a year, 12 log points a year, as a yearly percentage, 1950-2020, a grid of economies In the text: 69a 69bFirst Thing, computed (opens in a new tab). As of 1 October 2026. How it is computed (opens in a new tab).
- 0 windows, of them (growth at or below 12), inflation averaging 20% a year or more, 1950-2020, a grid of economies In the text: 70aFirst Thing, computed (opens in a new tab). As of 1 October 2026. How it is computed (opens in a new tab).
- 309 windows, decades, base money growth at or below 12 log pts a year, 1950-2020, a grid of economies In the text: 71aFirst Thing, computed (opens in a new tab). As of 1 October 2026. How it is computed (opens in a new tab).
- 22% % a year, 20 log points a year, as a yearly percentage, 1950-2020, a grid of economies In the text: 72aFirst Thing, computed (opens in a new tab). As of 1 October 2026. How it is computed (opens in a new tab).
- 7 windows, of them (growth above 12 to 20), inflation averaging 20% a year or more, 1950-2020, a grid of economies In the text: 73aFirst Thing, computed (opens in a new tab). As of 1 October 2026. How it is computed (opens in a new tab).
- 203 windows, decades, base money growth above 12 to 20 log pts a year, 1950-2020, a grid of economies In the text: 74aFirst Thing, computed (opens in a new tab). As of 1 October 2026. How it is computed (opens in a new tab).
- 35% % a year, 30 log points a year, as a yearly percentage, 1950-2020, a grid of economies In the text: 75aFirst Thing, computed (opens in a new tab). As of 1 October 2026. How it is computed (opens in a new tab).
- 17 windows, of them (growth above 20 to 30), inflation averaging 20% a year or more, 1950-2020, a grid of economies In the text: 76aFirst Thing, computed (opens in a new tab). As of 1 October 2026. How it is computed (opens in a new tab).
- 78 windows, decades, base money growth above 20 to 30 log pts a year, 1950-2020, a grid of economies In the text: 77aFirst Thing, computed (opens in a new tab). As of 1 October 2026. How it is computed (opens in a new tab).
- 38 windows, of them (growth above 30), inflation averaging 20% a year or more, 1950-2020, a grid of economies In the text: 78aFirst Thing, computed (opens in a new tab). As of 1 October 2026. How it is computed (opens in a new tab).
- 45 windows, decades, base money growth above 30 log pts a year, 1950-2020, a grid of economies In the text: 79aFirst Thing, computed (opens in a new tab). As of 1 October 2026. How it is computed (opens in a new tab).
- 12% % a year, the line on money growth (Teles and Uhlig's, adapted), 1950-2020, ten-year windows, a grid of economies In the text: 80a 80b 80cFirst Thing, computed (opens in a new tab). As of 1 October 2026. How it is computed (opens in a new tab).
- 76 economies, economies, broad money slope, energy-import control, money 2019-21, prices 2021-23, economies calm in 2015-19 In the text: 81aFirst Thing, computed (opens in a new tab). As of 10 October 2026. How it is computed (opens in a new tab).
- 0.27 points of inflation per point of money growth, slope on broad money, energy-import control, money 2019-21, prices 2021-23, economies calm in 2015-19 In the text: 82a 82bFirst Thing, computed (opens in a new tab). As of 10 October 2026. How it is computed (opens in a new tab).
- 0.10 points per point, slope, broad money, energy-import control: low end, money 2019-21, prices 2021-23, economies calm in 2015-19 In the text: 83aFirst Thing, computed (opens in a new tab). As of 10 October 2026. How it is computed (opens in a new tab).
- 0.48 points per point, slope, broad money, energy-import control: high end, money 2019-21, prices 2021-23, economies calm in 2015-19 In the text: 84aFirst Thing, computed (opens in a new tab). As of 10 October 2026. How it is computed (opens in a new tab).
- 0.10 points of inflation per point of money growth, slope on broad money, with 2021 inflation, money 2019-21, prices 2021-23, economies calm in 2015-19 In the text: 85a 85bFirst Thing, computed (opens in a new tab). As of 10 October 2026. How it is computed (opens in a new tab).
- 0.33 points per point, slope, broad money, with 2021 inflation: high end, money 2019-21, prices 2021-23, economies calm in 2015-19 In the text: 86aFirst Thing, computed (opens in a new tab). As of 10 October 2026. How it is computed (opens in a new tab).
What happens in a hyperinflation?
- 207% % a day, the equivalent daily inflation rate at the peak, July 1946, Hungary In the text: 87aHanke and Krus 2013, World Hyperinflations (opens in a new tab). As of 1 January 2013.
- 15 hours hours for prices to double, the time for prices to double at the peak, July 1946, Hungary In the text: 88aHanke and Krus 2013, World Hyperinflations (opens in a new tab). As of 1 January 2013.
Who gains and who pays when money is created?
- $54.9 billion billions of dollars remitted to the Treasury, the Reserve Banks' earnings remitted to the Treasury, 2019, the Federal Reserve Banks In the text: 89aFederal Reserve Banks, Combined Financial Statements 2019 (opens in a new tab). As of 1 March 2020.
- $16.6 billion billions of dollars (the deferred asset), the deferred asset (earnings to recover before remittances resume), end of 2022, the Federal Reserve Banks In the text: 90aFederal Reserve Banks, Combined Financial Statements 2023 (opens in a new tab). As of 1 March 2024.
- $243 billion billions of dollars (the deferred asset), the deferred asset (earnings to recover before remittances resume), end of 2025, the Federal Reserve Banks In the text: 91aFederal Reserve Banks, Combined Financial Statements 2025 (opens in a new tab). As of 1 March 2026.
- 5.2% % of GDP, present value, state's gain, five points a year of surprise inflation for ten years, low end, 1989 benchmark, the United States In the text: 92aDoepke and Schneider 2006, "Inflation and the Redistribution of Nominal Wealth", Journal of Political Economy 114(6) (opens in a new tab). As of 1 December 2006.
- 13% % of GDP, present value, state's gain, five points a year of surprise inflation for ten years, high end, 1989 benchmark, the United States In the text: 93aDoepke and Schneider 2006, "Inflation and the Redistribution of Nominal Wealth", Journal of Political Economy 114(6) (opens in a new tab). As of 1 December 2006.
- 5% percent, the share of households at the top of the distribution, 2012, UK households, the richest In the text: 94aBank of England, 'The Distributional Effects of Asset Purchases' (July 2012) (opens in a new tab). As of 12 July 2012.
If not central banks' "money printer", what should you watch?
- 5.7% % over twelve months, growth of M2, August 2025 to August 2026, the United States In the text: 96aFirst Thing, computed (opens in a new tab). As of 30 September 2026. How it is computed (opens in a new tab).
- 7.7% % over twelve months, growth of banks' loans and leases (monthly averages), September 2025 to September 2026, the United States In the text: 97aFirst Thing, computed (opens in a new tab). As of 10 October 2026. How it is computed (opens in a new tab).
- 6.3% % over four quarters, growth of nominal GDP (spending in dollars), to 2026Q2, the United States In the text: 98aFirst Thing, computed (opens in a new tab). As of 30 September 2026. How it is computed (opens in a new tab).
- 3.63% % a year, the effective federal funds rate, August 2026, the United States In the text: 99aFirst Thing, computed (opens in a new tab). As of 30 September 2026. How it is computed (opens in a new tab).
- 3.4% % over twelve months, consumer-price inflation (CPI-U), August 2025 to August 2026, the United States In the text: 100aFirst Thing, computed (opens in a new tab). As of 27 September 2026. How it is computed (opens in a new tab).
- 5.8% % of GDP, the federal deficit, fiscal year 2025, the United States In the text: 101aFirst Thing, computed (opens in a new tab). As of 30 September 2026. How it is computed (opens in a new tab).
- 8.5% % over a year, change in the Fed's holdings of Treasury securities, September 2025 to September 2026, the United States In the text: 102aFirst Thing, computed (opens in a new tab). As of 30 September 2026. How it is computed (opens in a new tab).
- 580 windows, ten-year windows drawn, 1960-2020, a grid of economies In the text: 103aFirst Thing, computed (opens in a new tab). As of 1 October 2026. How it is computed (opens in a new tab).
- 152 economies, economies drawn, 1960-2020, a grid of economies In the text: 104aFirst Thing, computed (opens in a new tab). As of 1 October 2026. How it is computed (opens in a new tab).
- 6.5% % a year, average yearly growth of M2, 1959Q4 to 2025Q4, the United States In the text: 105aFirst Thing, computed (opens in a new tab). As of 10 October 2026. How it is computed (opens in a new tab).
- 3.0% % a year, average yearly growth of real GDP, 1959Q4 to 2025Q4, the United States In the text: 106aFirst Thing, computed (opens in a new tab). As of 10 October 2026. How it is computed (opens in a new tab).
- 3.2% % a year, average yearly growth of the GDP price index, 1959Q4 to 2025Q4, the United States In the text: 107aFirst Thing, computed (opens in a new tab). As of 10 October 2026. How it is computed (opens in a new tab).
- 1.07 points of inflation per point, inflation per point of base money growth, above the line, 1950-2020, ten-year windows, a grid of economies In the text: 108aFirst Thing, computed (opens in a new tab). As of 1 October 2026. How it is computed (opens in a new tab).
- 0.25 points of inflation per point, inflation per point of base money growth, below the line, 1950-2020, ten-year windows, a grid of economies In the text: 109aFirst Thing, computed (opens in a new tab). As of 1 October 2026. How it is computed (opens in a new tab).
- 0.12 points of inflation per point, slope of inflation on base money growth, 1960-2020, calm ten-year windows, a grid of economies In the text: 110aFirst Thing, computed (opens in a new tab). As of 1 October 2026. How it is computed (opens in a new tab).
- 0.39 points of inflation per point, slope of inflation on broad money growth, 1960-2020, calm ten-year windows, a grid of economies In the text: 111aFirst Thing, computed (opens in a new tab). As of 1 October 2026. How it is computed (opens in a new tab).
- 0.27 points of inflation per point of money growth, broad money's slope less base money's, 1960-2020, calm ten-year windows, a grid of economies In the text: 112aFirst Thing, computed (opens in a new tab). As of 1 October 2026. How it is computed (opens in a new tab).