FT-001The life of a money, part 1
What gives a money its value?
In our reading, people take a money because they expect others to take it; the taxes and debts owed in it and what restrains its issuer make that reasonable, and no backing guaranteed it. From 1991 to 2025 a dollar lost 58% of what it bought, a pound 57%, a Swiss franc 24%, a yen 17%; since 1999 a euro 39% in Germany.
Tap or click a dot for its source, a number for where it comes from and an underlined word for its meaning.
A modern banknote is a promise its issuer never has to keep. Take one to the central bank, and you get another note. Yet people work a day for a few of these notes and hand one over for a sandwich. This study asks why. Why is a money worth anything at all? What decides how much it is worth? And what keeps it from losing that worth? The study calls every currency, from a Roman coin to the dollar, a money (in the plural, monies).
Short versionComplete on its own. About 2 minutes to read.
The answer in brief
In our reading, people take a money because they expect the next person to accept it. Two linked supports make that expectation reasonable (why people take a money).
- A floor. Taxes are owed in the money by law and debts are settled in it, so people need some of it. It is an anchor, not a requirement for a money to circulate: in theory, if those payments are heavy enough, they keep its value above zero, but they do not stop it losing almost everything if the issuer makes new money without limit (why people take a money).
- A restraint. Something stops the issuer from making too much of it. For the dollar, the euro, the Swiss franc and the yen, that is how the central bank reacts when inflation rises, as long as the state's finances let it act. The bank's mandate, written in law, gives this restraint its legal form (what restrains a paper money).
How much a unit buys depends on how much is made, and on that restraint (what decides how much a unit buys). From 1991 to 2025 a dollar lost 58% (number 1a: where it comes from) of what it bought, a pound 57% (number 2a: where it comes from), a Swiss franc 24% (number 3a: where it comes from) and a yen 17% (number 4a: where it comes from); from 1999 to 2025 a euro lost 39% (number 5a: where it comes from) in Germany (what a unit buys). For the dollar that is about 2.5% (number 6a: where it comes from) a year on average, close to the 2% (number 7a: where it comes from) inflation that the Fed and the ECB aim for.
Money created for the state stood behind every destroyed money the sources studied (Germany in 1923, Bolivia in 1985, Zimbabwe in 2007 and 2008), though it did not always destroy a money (why some monies were destroyed).
- Abroad, a money can lead with no backing: once commodities are left out, far more of world trade is priced in dollars than is sold to the United States, and since Bretton Woods ended, habit and the credibility of its policy have counted for more in central banks' choice of a reserve currency, and the size of its economy for less (what makes a money strong abroad).
- A gold backing did not guarantee a money's safety: states suspended it, broke it under debt or gave it up (how a backing ended; prices under gold and paper).
- Trust alone went only so far: Somalia's shilling circulated with no state behind it, but mostly for small payments, and one case cannot show how far trust alone goes (the cases).
Where money comes from is the subject of the next part of this series. This frame is our judgement, drawn from the sources; the cases illustrate it rather than test it. At the end are five questions to ask of any money, yours included (what to ask of any money).
What is a money's value, and how much has it lost?
A money's value can mean two things. The first is what a unit buys at home: its purchasing power. When prices double, a unit's purchasing power halves. The second is what a unit trades for abroad: its exchange rate. The two can move apart, so this study keeps them apart.
Go deeperWhat holding money costs, and why the size of a unit says little
People hold a paper money to buy goods and services, because everyone accepts it. The money yields nothing in itself, and holding it has a cost: the interest people could earn by lending the same sum insteadSource: Walsh 2010, Monetary Theory and Policy, ch. 2, on the demand for money; a book, listed in the methods' sources (opens in a new tab).
What matters is whether a unit keeps what it buys, not how many units a sandwich costs. States can change the unit. France's new franc of January 1960 was worth 100 (number 8a: where it comes from) old francsSource: BIS 1960, 30th Annual Report, printed p. 157 (opens in a new tab). Turkey's new lira of January 2005 was worth 1,000,000 (number 9a: where it comes from) old liraSource: ECB, the page on the Turkish lira, euro reference rates (opens in a new tab). A small unit, like a yen worth less than a US cent, says nothing by itself about a country.
Since 1992, a dollar has lost 58% (number 1b: where it comes from) of what it bought in 1991, a pound 57% (number 2b: where it comes from), a Swiss franc 24% (number 3b: where it comes from) and a yen 17% (number 4b: where it comes from), by 2025, and from 1999 to 2025 a euro lost 39% (number 5b: where it comes from) of what it bought in Germany. From 1992 to 2025, the yearly loss of what a unit buys averaged between 0.6% (number 10a: where it comes from), for the yen, and 2.5% (number 6b: where it comes from), for the dollar (the first case study, what a unit of money buys).
Pick a year on the slider. It shows, money by money, what one unit of that year would buy in 2025.
What one unit of a year buys in 2025
At the default settings (Year: 1971):
- One US dollar of that year, in 2025 dollars: $7.95
- One pound of that year, in 2025 pounds: £13.06
- One Swiss franc of that year, in 2025 francs: 2.97 francs
- One yen of that year, in 2025 yen: 3.40 yen
- One French franc of that year (from 1999, one euro), in 2025 euros: €1.200
- One Mark of that year (from 1999, one euro), in 2025 euros: €2.11
- One Reichsmark of that year, in 1947 Reichsmarks: –
A dash means the money's series does not cover that year. The franc before 1960 is the old franc (100 to a new franc); the euro took over at 6.55957 francs and 1.95583 Marks. The Reichsmark stops in 1947: the reform of 1948 converted money at several rates, so it is not chained to the Deutsche Mark.
Source: BIS long consumer-price series; the official conversion factors (the BIS, 1960; the ECB, 1998)
Our case studyWhat a unit of money buys, from 1914 to 2025From 1991 to 2025 a unit lost 17% (yen) to 58% (dollar) of what it bought; a euro 39% in Germany, 1999 to 2025.Six monies, from 1914 to 2025, on the BIS's long series of consumer prices
How much of what it buys has each money lost, period by period? This case follows one unit of each money through its consumer prices, year by year, from 1914 or from the first year its prices allow. The euro has two rows, one for its prices in France and one for its prices in Germany. Before 1999 these rows show the French franc and the Deutsche Mark. The four periods are the world wars and the slump, the fixed exchange rates after the war, the years after gold, and the last third of a century, about a working life.
What each money lost a year, by period
yearly loss of what one unit buys, % a year; 1913-2025; the reader's monies
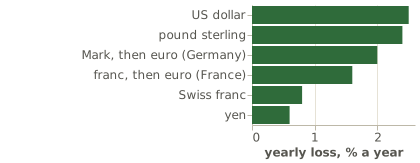
For each period (1914-45, 1946-71, 1972-91, 1992-2025), the average yearly loss of what one unit of the dollar, the pound, the Swiss franc, the yen, the French franc then the euro in France, the Mark then the euro in Germany, and the Reichsmark bought, from the BIS's consumer prices. A money appears only in the periods its series covers.
Data table
| money | period | loss |
|---|---|---|
| US dollar | 1914-45 | 1.9 |
| US dollar | 1946-71 | 3.1 |
| US dollar | 1972-91 | 5.9 |
| US dollar | 1992-2025 | 2.5 |
| pound sterling | 1914-45 | 3.1 |
| pound sterling | 1946-71 | 4.3 |
| pound sterling | 1972-91 | 8.3 |
| pound sterling | 1992-2025 | 2.4 |
| Swiss franc | 1914-45 | 0.2 |
| Swiss franc | 1946-71 | 1.9 |
| Swiss franc | 1972-91 | 4.0 |
| Swiss franc | 1992-2025 | 0.8 |
| yen | 1946-71 | 7.4 |
| yen | 1972-91 | 5.0 |
| yen | 1992-2025 | 0.6 |
| franc, then euro (France) | 1946-71 | 4.2 |
| franc, then euro (France) | 1972-91 | 7.3 |
| franc, then euro (France) | 1992-2025 | 1.6 |
| Mark, then euro (Germany) | 1946-71 | 1.9 |
| Mark, then euro (Germany) | 1972-91 | 3.6 |
| Mark, then euro (Germany) | 1992-2025 | 2.0 |
| Reichsmark | 1914-45 | 0.5 |
From 1992 to 2025 as a whole, a dollar lost 58% (number 1c: where it comes from) of what it bought in 1991. A pound lost 57% (number 2c: where it comes from), a Swiss franc 24% (number 3c: where it comes from) and a yen 17% (number 4c: where it comes from). From 1999, when the euro was created, to 2025, a euro lost 39% (number 5c: where it comes from) of what it bought in Germany. From 1972 to 1991 the losses were larger. They ran from 3.6% (number 11a: where it comes from) a year for the Deutsche Mark to 8.3% (number 12a: where it comes from) for the pound, and the dollar lost 5.9% (number 13a: where it comes from) a year. The table gives the average yearly loss in each period.
Table, 7 rowsYearly loss of what a unit buys
The Reichsmark's small loss uses official prices, which a freeze on prices held down from 1936Source: Mendershausen 1949, p. 649, the price stop of 1936 (opens in a new tab).
These figures describe each money, not its central bank. Whether a target or a mandate kept the recent losses small is a separate question (what restrains a paper money).
Method, data and code for this case study (opens in a new tab)
Central banks such as the ECB now aim for a small loss each year. The ECB aims at inflation of 2% (number 31a: where it comes from), not zeroSource: ECB, 'Two per cent inflation target', section on the reasons for the target (opens in a new tab).
One reason is to stay clear of deflation (a general fall in prices), because "there are limits to how far interest rates can be cut". The other reasons are that wages rarely fall, and that a price index may overstate inflationSource: ECB, 'Two per cent inflation target', section on the reasons for the target (opens in a new tab).
Go deeperWhy a money that buys more each year is not better for that alone
A money that buys more each year is not a better money for that reason alone. When prices fall, debts become heavier to repay, because each unit owed buys more. Fisher saw where this can lead: debtors pay, and yet their debt weighs more. In his words, when prices fall, "the more the debtors pay, the more they owe"Source: Fisher 1933, The Debt-Deflation Theory of Great Depressions, para. 32 (p. 54 of the reprint held); listed in the methods' sources (opens in a new tab).
Go deeperBritain's return to gold, and the countries that stayed on gold
A money set too high against gold was not a better money. In April 1925 Britain returned to gold at its pre-war rate of $4.86 (number 32a: where it comes from). Since Keynes, most observers have judged this rate too high for the pound, by at least 10% (number 33a: where it comes from). Britain kept that rate only until it left gold again in 1931Source: Moggridge 1972, British Monetary Policy 1924–1931, p. 1 and p. 100; a book, listed in the methods' sources (opens in a new tab). In the countries that stayed on gold after 1931 (the gold bloc), prices kept falling, though more slowly than before, until the last of them left gold in 1936Source: Bernanke and James 1991, p. 42; Tables 2.1 and 2.2 (opens in a new tab). In 1935 their industrial production was still below its level of 1929Source: Eichengreen and Sachs 1985, p. 9 (opens in a new tab).
Why do people take a money?
Why would anyone accept a note when its issuer will give only another note in exchange for it? Theory gives two answers: people take a money because they expect others to take it, and because the state requires taxes to be paid in it. The first answer, convention, appears in Samuelson's model, in which each generation hands money on to the nextSource: Samuelson 1958, 'An Exact Consumption-Loan Model of Interest', Journal of Political Economy 66(6), pp. 481–482; listed in the methods' sources (opens in a new tab). It appears too in Kiyotaki and Wright's model, in which strangers trade with each otherSource: Kiyotaki and Wright 1993, 'A Search-Theoretic Approach to Monetary Economics', American Economic Review 83(1), p. 68; listed in the methods' sources (opens in a new tab). In both models, a money with no backing can keep its value, because each holder expects the next holder to take it. But the same models also allow an outcome in which nobody takes the money, and then it is worthlessSource: Ljungqvist and Sargent 2012, Recursive Macroeconomic Theory, 3rd ed., §9.4; a book, listed in the methods' sources (opens in a new tab).
Starr proved the second answer, the state, in a model of many traders. In his model, if the taxes that must be paid in money are large enough, money keeps a value above zero in every outcome the model allows. If the taxes are too small, money may be worth nothingSource: Starr 1974, 'The Price of Money in a Pure Exchange Monetary Economy with Taxation', Econometrica 42(1), pp. 46, 54; listed in the methods' sources (opens in a new tab).
Go deeperThe same point in Woodford's model
Woodford makes the point about taxes in a model in which every household is alike. In that model, take a money that its issuer never exchanges for anything, and that pays its holders nothing but more of the same money. Such a money cannot hold its value. Woodford calls it a pure "bubble". Once some of that money is "accepted as payment for taxes", it "ceases to be a pure bubble"Source: Woodford 2003, Interest and Prices, ch. 2; a book, listed in the methods' sources (opens in a new tab).
The fiscal theory of the price level is the main alternative to our reading of the restraint. In it, what holds prices is mainly the budget surpluses the state is expected to have (what it collects beyond what it spends), not a central bank's mandate alone. This study does not test one against the other. It reads its cases through the two supports, and the fiscal theory would read them through the state's budget.
Go deeperWhere the fiscal theory comes from, and how it goes further than Starr's result
When a government requires its money for taxes, people value the money even if nobody needed it to trade. Cochrane treats this tax view as equivalent to the fiscal theory. That theory carries the tax view over all the years ahead: a state's money and debt are worth what its future budget surpluses can paySource: Cochrane 2000, 'Money as Stock', NBER w7498, p. 1 (opens in a new tab).
We see a difference between Starr's result and the fiscal theory. Starr's taxes keep a money's value above zero. The fiscal theory also sets how high prices are, from the surpluses the state is expected to have. Many models of money allow prices to settle at many different levels. Critics see the fiscal theory as a way of picking one of those levelsSource: Ljungqvist and Sargent 2012, §26.4.2, quoting Kocherlakota and Phelan 1999; a book, listed in the methods' sources (opens in a new tab).
Go deeperA guarantee that works like a partial backing
In Obstfeld and Rogoff's model, a guarantee works like a partial backing. The government promises that its money can always be exchanged for at least a small amount of goods. In that model, the promise stops prices from shooting up on people's expectations alone, with no link to the growth of moneySource: Obstfeld and Rogoff 1983, 'Speculative Hyperinflations in Maximizing Models', Journal of Political Economy 91(4), p. 675; listed in the methods' sources (opens in a new tab).
Go deeperHow taxes came before legal tender, and what legal tender requires
Paper money in the American colonies began with the floor: taxes payable in the new money. Massachusetts first issued paper money in 1690. Its war issues of 1690 and 1691 came with taxes, voted at the same time, that would bring the notes back to the treasury. New England's early notes could be paid in taxes and taken back by the treasury. Massachusetts notes became legal tender only later, by an act of December 1692Source: Grubb 2012, pp. 3, 7, 9, 10; Table A1, p. 59, and its note b (opens in a new tab). So the tax came first, and legal tender after.
What legal tender requires differs by place. In the United States, notes are "legal tender for all debts, public charges, taxes, and dues": they can settle any debt owed to a creditor. A sale in a shop is a different matter: no federal law obliges a private business to accept cashSource: Federal Reserve, FAQ 'Is it legal for a business in the United States to refuse cash?'; listed in the methods' sources (opens in a new tab). In the euro area, notes and coins are legal tender, and shops "are generally obliged to accept cash"Source: ECB, 'Access to and acceptance of cash', section on acceptance (opens in a new tab).
A money can circulate without a floor. After the Somali state collapsed in 1991, the Somali shilling stayed in use, although no authority resembling a state supported it. Its rate against the dollar moved daily, and private printers added an estimated 481 (number 34a: where it comes from) billion shillings of notes. Luther and White, who studied the case, read this as evidence that the shilling kept a value above zero. In their dating, no government at all supported the shilling in two periods: from January to May 1991, and from January 1995 to August 1998Source: Luther and White 2011, section 2.2 (opens in a new tab).
Between those two periods, Somaliland (the north of Somalia, which broke away) accepted the old shilling for taxes. Luther and White doubt that the shilling needed this help. Somaliland began issuing notes of its own in November 1994, and on the 31st of January 1995 it ended the old shilling's status as legal tenderSource: Luther and White 2011, section 2.3 (opens in a new tab).
Go deeperA money no one could print any more: the Swiss dinar in northern Iraq
A money that no one can print any more can keep its value beside a rival money that keeps being printed. In northern Iraq, no one could print the old "Swiss" dinars any more, and their supply "had remained essentially fixed for 13 (number 35a: where it comes from) years". The Swiss dinar rose against the dinar that Baghdad kept printing. When a new dinar replaced both after the war of 2003, each Swiss dinar was exchanged for 150 (number 36a: where it comes from) new dinarsSource: Foote, Block, Crane and Gray 2004, p. 61 (opens in a new tab).
A money that is legal tender can still be replaced. In 1999 the money issued by Ecuador's central bank grew 136% (number 37a: where it comes from). The same year, the sucre lost two-thirds of its value against the dollar. In January 2000 the government fixed the sucre's rate and announced that it would adopt the dollar by law. Consumer prices rose 96% (number 38a: where it comes from) in 2000Source: Beckerman and Solimano 2002, Crisis and Dollarization in Ecuador, pp. 17–18, 45, 57 (opens in a new tab).
We judge that trust in a money is reasonable where the money has a floor and the amount issued is restrained. The Somali shilling was held only because people expected others to take it, and only beside the dollar. In northern Iraq, the old "Swiss" dinar kept its value because no more of it could be made. The sucre was legal tender, yet the state replaced it with the dollar once the amount of sucres issued was no longer controlled.
What decides how much a unit of money buys?
What a unit buys depends on two amounts: the quantity of money that exists, and the quantity that people want to hold. Both matter today, and so do people's expectations of both for tomorrow. The quantity matters most when a money is printed fastSource: De Grauwe and Polan 2005, p. 256, the conclusion (opens in a new tab). Where money comes from, and what inflation is, are the subjects of the next study.
Go deeperHow closely money growth and inflation go together
Money growth is the rise in the quantity of money. In De Grauwe and Polan's words, the strong link between money growth and inflation "is almost wholly due to the presence of high-inflation or hyper-inflation countries". For countries whose inflation averaged less than 10% (number 39a: where it comes from) a year over thirty years, they call the link "weak, if not absent". Even there, their own estimates of the link stay above zeroSource: De Grauwe and Polan 2005, p. 256, the conclusion (opens in a new tab).
Expectations move a money's value before the quantity does. In the American Civil War, expectations of a return to gold set the exchange rate and the price level of the greenbackSource: Calomiris 1988, p. 720 (opens in a new tab).
Go deeperHow four inflations ended once a change of policy was believed, and the greenback moved with news from the war
Four big inflations of the 1920s ended when governments changed their policy on deficits. The change was firm enough that people believed it would last: in Sargent's words, it was "sufficiently binding as to be widely believed"Source: Sargent 1982, The Ends of Four Big Inflations, pp. 42, 45 (opens in a new tab).
The greenback's price in gold moved with the news from the war. Speculators understood that whether the notes would be paid in gold depended on how the war went for the UnionSource: Calomiris 1988, p. 719 (opens in a new tab). The greenback's largest single move of the war came in July 1864, when Early's raid on Washington endedSource: Willard, Guinnane and Rosen 1995, p. 17 (opens in a new tab).
A money that cannot be exchanged for gold can return to its full value in gold. Two paper currencies did: the greenback, and Britain's paper pound of the Napoleonic wars (the case study on paper in gold). Both lost much of their value in gold, and both won all of it back once their wars were over and their states paid in gold again. The greenback's return came with years of falling prices: US consumer prices fell in every year but one from 1870 to 1878, by 24% (number 40a: where it comes from) in allSource: Jordà, Schularick and Taylor, Macrohistory Database R6, USA, consumer prices, 1870 to 1878 (opens in a new tab).
Our case studyWhat the greenback and the paper pound were worth in goldThe greenback fell to 39% of its value in gold in its lowest month, and was back at full value by the end of 1878. The paper pound, on yearly averages, fell to 75% and was back in 1821.The greenback month by month from 1862 to 1878, and the paper pound year by year from 1800 to 1821
How far did these two paper currencies fall below their full value in gold, and did they come back? At its lowest, measured month by month, the greenback was worth 39% (number 41a: where it comes from) of its value in gold. At its lowest, measured by yearly averages, the paper pound was worth 75% (number 42a: where it comes from). The two lows are measured differently. The case rules out the idea that a money which cannot be exchanged for gold is bound to stay below its full value in gold.
The greenback's value in gold, 1862-1878
paper's value in gold, % of par; 1862-1878; the greenback
The value of a paper dollar in gold, monthly, from Mitchell's table of the gold price in greenbacks. Par is 100%.
Data table
| period | value |
|---|---|
| 1862-01 | 97.6 |
| 1862-02 | 96.6 |
| 1862-03 | 98.2 |
| 1862-04 | 98.5 |
| 1862-05 | 96.8 |
| 1862-06 | 93.9 |
| 1862-07 | 86.6 |
| 1862-08 | 87.3 |
| 1862-09 | 84.4 |
| 1862-10 | 77.8 |
| 1862-11 | 76.3 |
| 1862-12 | 75.6 |
| 1863-01 | 68.9 |
| 1863-02 | 62.3 |
| 1863-03 | 64.7 |
| 1863-04 | 66.0 |
| 1863-05 | 67.2 |
| 1863-06 | 69.2 |
| 1863-07 | 76.6 |
| 1863-08 | 79.5 |
| 1863-09 | 74.5 |
| 1863-10 | 67.7 |
| 1863-11 | 67.6 |
| 1863-12 | 66.2 |
| 1864-01 | 64.3 |
| 1864-02 | 63.1 |
| 1864-03 | 61.4 |
| 1864-04 | 57.9 |
| 1864-05 | 56.7 |
| 1864-06 | 47.5 |
| 1864-07 | 38.7 |
| 1864-08 | 39.4 |
| 1864-09 | 44.9 |
| 1864-10 | 48.3 |
| 1864-11 | 42.8 |
| 1864-12 | 44.0 |
| 1865-01 | 46.3 |
| 1865-02 | 48.7 |
| 1865-03 | 57.5 |
| 1865-04 | 67.3 |
| 1865-05 | 73.7 |
| 1865-06 | 71.4 |
| 1865-07 | 70.4 |
| 1865-08 | 69.7 |
| 1865-09 | 69.5 |
| 1865-10 | 68.7 |
| 1865-11 | 68.0 |
| 1865-12 | 68.4 |
| 1866-01 | 71.4 |
| 1866-02 | 72.3 |
| 1866-03 | 76.6 |
| 1866-04 | 78.6 |
| 1866-05 | 75.9 |
| 1866-06 | 67.2 |
| 1866-07 | 66.0 |
| 1866-08 | 67.2 |
| 1866-09 | 68.7 |
| 1866-10 | 67.4 |
| 1866-11 | 69.5 |
| 1866-12 | 73.2 |
First 60 of 204 rows. The full table is in the download.
The paper pound's value in gold, 1800-1821
paper's value in gold, % of par; 1800-1821; the paper pound
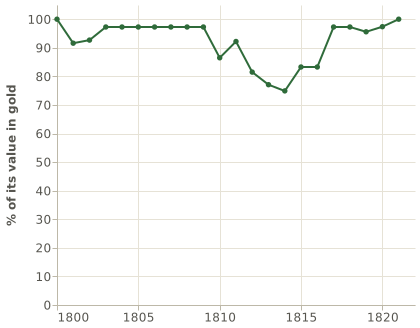
The value of a paper pound in gold, yearly, from Tooke's table of the average price of gold. Par is 100%.
Data table
| period | value |
|---|---|
| 1800 | 100.0 |
| 1801 | 91.6 |
| 1802 | 92.7 |
| 1803 | 97.3 |
| 1804 | 97.3 |
| 1805 | 97.3 |
| 1806 | 97.3 |
| 1807 | 97.3 |
| 1808 | 97.3 |
| 1809 | 97.3 |
| 1810 | 86.5 |
| 1811 | 92.2 |
| 1812 | 81.5 |
| 1813 | 77.1 |
| 1814 | 74.9 |
| 1815 | 83.3 |
| 1816 | 83.3 |
| 1817 | 97.3 |
| 1818 | 97.3 |
| 1819 | 95.6 |
| 1820 | 97.4 |
| 1821 | 100.0 |
Method, data and code for this case study (opens in a new tab)
Why were some monies destroyed?
This study names two degrees of loss. A money is destroyed when its prices rise by half or more in a single month. This is Cagan's threshold for a hyperinflationSource: Cagan 1956, The Monetary Dynamics of Hyperinflation; a book chapter, listed in the methods' sources (opens in a new tab). A smaller loss is an inflation crisis: a year in which a money's prices rise by a fifth or more. This is the threshold Reinhart and Rogoff useSource: Reinhart and Rogoff 2009, This Time Is Different; a book, listed in the methods' sources (opens in a new tab).
Where a state borrowed new money from its central bank without limit, that money grew far beyond what people wanted to hold: Germany in 1923 and Bolivia in 1985. Where the amount issued was capped and the budget balanced, the money kept its value again, as Germany's Rentenmark did. We judge that these cases illustrate both sides of the link between the two supports: the floor keeps a demand for the money, and the restraint keeps new money from growing far beyond that demand.
In Romer's textbook, the underlying cause of "most, if not all, episodes of high inflation and hyperinflation" is the government's need for revenue from printing moneySource: Romer 1996, Advanced Macroeconomics, section 9.7; a book, listed in the methods' sources (opens in a new tab).
Go deeperWhy a state comes to need money printed for it
The same textbook's next sentences say why a state comes to need that revenue. Wars, falls in export prices, tax evasion and political deadlock "frequently leave governments with large budget deficits". When investors will not buy the government's bonds, its "only choice" is to pay for its spending by printing money. That revenue is called seigniorageSource: Romer 1996, section 9.7, the sentences after (opens in a new tab).
In theory, there is a limit to how much revenue a state can raise by printing money over a long period, and hyperinflations arise when the state needs more than thatSource: Romer 1996, Advanced Macroeconomics, section 9.7, 'Seignorage and Hyperinflation', after Cagan 1956 (opens in a new tab). No source we read says in advance where that limit lay for a given money, and this study does not set one either.
Go deeperWhat other studies found on the causes of high inflation
Cagan found the same cause in the hyperinflations he studied. Printing money "was a convenient way to provide the government with real resources" for governments "too weak to enact adequate tax programs"Source: Cagan 1956, pp. 77–78; a book chapter, listed in the methods' sources (opens in a new tab).
Two studies of many countries ask whether budget deficits go with inflation. Fischer, Sahay and Végh find that budget deficits explain high inflation. Where inflation is low, they find no clear link between deficits and inflation, in the short run or the long run, and no significant long-run link when they compare countriesSource: Fischer, Sahay and Végh 2002, pp. 10, 17, 34 (opens in a new tab). Catão and Terrones disagree. Measuring deficits in another way, they find a long-run link between deficits and inflation across more than a hundred countries, from 1960 to 2001. The link is strong among developing and high-inflation countries, and it is not found among low-inflation advanced onesSource: Catão and Terrones 2005, 'Fiscal Deficits and Inflation', Journal of Monetary Economics 52, pp. 529–532; listed in the methods' sources (opens in a new tab).
These are the sources' findings, for the episodes and countries they studied. The cases below show the forms that money created for the state took. They do not show how often it destroyed a money.
In what forms was money created for the state?
Money created for the state took four forms: the state's own paper money, loans from the central bank to the state, loans from the central bank to banks that hold the state's bonds, and the central bank's losses on spending it does for the state.
The first form is the state's own paper.
Go deeperThe state's own paper: France's assignats
France's revolutionary state printed notes called assignats. By June 1793 the assignats had fallen to about half their face value in goldSource: Velde and Weir 1992, p. 17, note 49; listed in the methods' sources (opens in a new tab)Source: Sargent and Velde 1995, pp. 500, 503, 504 (opens in a new tab). From May to December 1795 they went through a hyperinflation by Cagan's thresholdSource: Sargent and Velde 1995, p. 501, note 37 (opens in a new tab). In 1796 the assignats were exchanged for a new note, the mandat.
The second form is credit from the central bank to the state. In 1923 Germany's Ruhr region was under foreign occupation, and its workers were on strike. Germany paid the strikers by selling short-term government debts to the Reichsbank, its central bank. The Reichsbank paid for them with new money. A decree of November 1923 ended these salesSource: Sargent 1982, pp. 73, 75; p. 82, Table G4, note 3 (opens in a new tab).
Then the amount of new money was capped. By Sargent's account, the Rentenbank decree limited Germany's new money, the Rentenmark, to 3.2 (number 43a: where it comes from) billion Rentenmarks in all, and at most 1.2 (number 44a: where it comes from) billion of those could go to the government. After that, the government stopped borrowing, its budget balanced, and inflation stoppedSource: Sargent 1982, p. 83 (opens in a new tab). Help from outside also played its part. The payments Germany owed for the First World War (its reparations) were "temporarily suspended", and the Dawes plan set "a much more manageable schedule of payments"Source: Sargent 1982, p. 84 (opens in a new tab).
Go deeperWhat the Rentenmark rested on
The Rentenmark was based on the yearly payments due on a mortgage over the assets of the "productive classes". It was not made legal tender. By law, it was accepted in all offices handling money in the ReichSource: Feldman 1993, The Great Disorder, p. 752; listed in the methods' sources (opens in a new tab). Sargent calls the change of unit (one Rentenmark for a trillion paper marks) "only a cosmetic measure"Source: Sargent 1982, pp. 82–83 (opens in a new tab).
Go deeperAustria: a war paid for with new money, and how its inflation ended
In August 1914 Austria-Hungary suspended two rules of its central bank: the gold behind its notes, and its ban on lending to the government. After the war, Austria went on paying for its deficits with new money from its central bank (monetising them)Source: Garber and Spencer 1994, pp. 5–7; Table 2 (opens in a new tab).
Between July 1914 and October 1918, the Austrian government's debts to the bank rose from 60 (number 45a: where it comes from) to 19,694 (number 46a: where it comes from) million crowns at face valueSource: Garber and Spencer 1994, pp. 5–7; Table 2 (opens in a new tab).
Austria's inflation, one of the four big inflations of the 1920s that Sargent describes, ended in 1922. That October, the League of Nations intervened, and under three agreements Austria's government bound itself to new policies for its budget and its moneySource: Sargent 1982, p. 49; section 2.3, p. 52 (opens in a new tab).
In Bolivia in 1984, loans from the central bank were, in Sachs's words, "the only domestic source of budget financing". Prices rose 183% (number 47a: where it comes from) in February 1985 aloneSource: Sachs 1986, abstract; pp. 14–15, 17; Table 1(c) (opens in a new tab).
A stabilisation programme began in August 1985, and the hyperinflation quickly ended. From February to October 1986, inflation ran at a yearly rate of about 25% (number 48a: where it comes from)Source: Sachs 1986, abstract; pp. 14–15, 17; Table 1(c) (opens in a new tab).
The third form is loans from the central bank to banks that hold the state's bonds.
Go deeperLoans to banks that hold the state's bonds: Ecuador
In Ecuador, a 1992 law barred the central bank from lending directly to the public sector. In 1998 and 1999 the Treasury issued some US$1.6 billion (number 49a: where it comes from) of bonds to rebuild the capital of banks and to pay out guaranteed deposits. The banks used many of these bonds to borrow from the central bank, which acquired some US$1.2 billion (number 50a: where it comes from) of themSource: Beckerman and Solimano 2002, ch. 2 by Beckerman, pp. 45, 57 (opens in a new tab). That lending was part of the growth in the money issued by Ecuador's central bank in 1999. The growth ended when Ecuador gave up the sucre for the dollar (why people take a money).
The fourth form is the losses a central bank makes on spending it does for the state, its quasi-fiscal activity. Such a loss works like a budget deficit, but the government's budget figures leave it outSource: World Bank 2010, Zimbabwe Public Expenditure Notes, p. 3, note 2 (opens in a new tab). This study does not count as this form the losses that come from interest rates moving on the central bank's own bonds. Zimbabwe shows the fourth form. A World Bank box on Zimbabwe's central bank calls 2004 to 2007 "the hyperinflation period"Source: World Bank 2021, Zimbabwe Economic Update, Issue 3, Box 1, p. 11 (opens in a new tab). Those years stop before the worst of it: Hanke and Krus date Zimbabwe's hyperinflation from March 2007 to mid-November 2008Source: Hanke and Krus 2013, 'World Hyperinflations', the table; listed in the methods' sources (opens in a new tab).
Go deeperZimbabwe's central bank: what the World Bank found, how large its losses were, and how the inflation ended
The World Bank attributes the soaring inflation of 2004 to 2007 to the central bank's spending on the state's behalf (its quasi-fiscal activity), "rather than conventional government budget deficits"Source: World Bank 2021, Zimbabwe Economic Update, Issue 3, Box 1, p. 11 (opens in a new tab).
The World Bank puts the losses that Zimbabwe's central bank actually made on this activity at about 75% (number 51a: where it comes from) of Zimbabwe's yearly output (GDP) in 2006Source: World Bank 2021, Zimbabwe Economic Update, Issue 3, Box 1, p. 11 (opens in a new tab).
In early 2009 Zimbabwe adopted foreign currencies as its money, and prices stabilised. The World Bank reports the government's argument that, under this system, the state cannot pay for its spending by creating money: "it is not possible to finance expenditure by monetary expansion"Source: World Bank 2010, pp. 4, 25 (opens in a new tab).
Not every purchase of the state's bonds is one of these four forms. A central bank can also buy, in the market, bonds that investors first bought from the state, with no promise to the state to do so. The next study tells what the purchases of 2008 to 2022 did to the quantity of money. It leaves open whether those purchases amounted to paying for the state.
Go deeperPurchases that sit between the market and the four forms
We place some purchases between these market purchases and the four forms: buying the state's debt to hold its price, or the interest rate it pays. The Fed did this from 1942 to 1951, and the Bank of Japan from 2016 to 2024. Their purchases were made in the market, but at a price the central bank had committed to hold. The next section tells both.
Did money created for the state always destroy a money?
Money created for the state did not always destroy a money, as Japan's yen after the Second World War shows. After the war, Japan's Reconstruction Finance Bank was "funded mainly by selling bonds to the Bank of Japan"Source: Hoshi and Kashyap 2001, Corporate Financing and Governance in Japan, pp. 64, 74; a book, listed in the methods' sources (opens in a new tab). Japan's prices rose almost fast enough to destroy the yen. On the Bank of Japan's official index of retail prices in Tokyo, prices doubled in two months or less, from November to the end of December 1945, and doubled again by the end of March 1946Source: Hoshi and Kashyap 2001, p. 64; a book, listed in the methods' sources (opens in a new tab). A doubling in two months comes close to Cagan's threshold for a destroyed money, but the source gives no figure for any single month.
On van Leeuwen's long yearly series, as the Macrohistory Database carries it, Japan had an inflation crisis every year from 1944 to 1949, and its consumer prices still rose 32% (number 52a: where it comes from) in 1949Source: Jordà, Schularick and Taylor, Macrohistory Database R6, Japan, consumer prices, 1944 to 1949 (opens in a new tab). That series also puts a jump in 1945 that the Tokyo index does not confirm, so this study does not print its figure for that year.
Go deeperHow the Bank of England stopped paying gold for its notes, and started again
The Bank of England lent to the government in its own notes. In 1797 it was instructed to stop exchanging its notes for gold. Parliament ordered the return to gold in 1819, and the right to exchange notes for gold (convertibility) came back in 1821Source: Calomiris and Haber 2014, Fragile by Design, ch. 4; a book, listed in the methods' sources (opens in a new tab).
Go deeperThe greenbacks, and the Fed holding down the cost of the state's debt
The greenbacks could not be exchanged for gold either. They fell to 39% (number 41b: where it comes from) of their value in gold in July 1864, and were back at their full value by December 1878. They could be exchanged for gold again from January 1879Source: Bordo and Schwartz 1994, Table 1A, pp. 57–58; text p. 12 (opens in a new tab).
From 1942 the Fed held the interest rates on Treasury debt down. It bought all the short-term Treasury debts offered at the fixed price, and by the end of the war it "held virtually the entire supply of Treasury bills". The Accord of March 1951 ended the fixed priceSource: Eichengreen and Garber 1991, pp. 180, 181, 184 (opens in a new tab).
Go deeperHow far US prices rose when wartime controls ended
The dollar was not destroyed. Under price controls, measured US prices rose little until June 1946Source: Rockoff 1981, 'Price and Wage Controls in Four Wartime Periods', Journal of Economic History 41(2), p. 382, Table 1; listed in the methods' sources (opens in a new tab). When the controls ended, consumer prices rose 18% (number 53a: where it comes from) in the year to December 1946, and 19.7% (number 54a: where it comes from) in the year to March 1947, just short of a fifthSource: BLS, CPI-U, all items, not seasonally adjusted (CUUR0000SA0), monthly, twelve-month changes (opens in a new tab). Wholesale prices rose 25% (number 55a: where it comes from) in a yearSource: Eichengreen and Garber 1991, p. 183 (opens in a new tab). US consumer prices did not rise by a fifth or more in a year in the whole time the Fed held rates down, nor in any year since 1920 (the crisis count). From 1946 to 1971 a dollar lost 3.1% (number 15b: where it comes from) of what it bought each year, on average (the first case study).
Go deeperJapan's central bank and the state's bonds, before the war and since
From September 2016 the Bank of Japan bought government bonds to keep the interest rate on ten-year government bonds close to zero (a policy called yield-curve control)Source: Bank of Japan 2016, statement of 21 September 2016, pp. 1–2 (opens in a new tab). In March 2024 the Bank judged that the policy had fulfilled its role, and ended itSource: Bank of Japan 2024, statement of 19 March 2024, p. 1 (opens in a new tab). The yen was not destroyed.
From November 1932 the Bank of Japan underwrote the government's bonds: it bought them directly from the government when they were issued. Consumer prices rose between 1.1% (number 56a: where it comes from) and 3.1% (number 57a: where it comes from) a year until 1936. By 1935 the finance minister, Takahashi, tried to stop these purchases. He was assassinated in February 1936Source: Eggertsson 2006, pp. 34–35, Table 4 (opens in a new tab).
Two later leaders of the Bank of Japan disagree on what this scheme led to. Deputy Governor Iwata blamed how the Bank handled its bond buying after Takahashi's death, not Takahashi's policy itselfSource: Iwata 2013, remarks in Tokyo, 27 October 2013 (opens in a new tab). Governor Shirakawa blamed the scheme itself: in his reading, it later let the state's spending grow very large. In his words, the scheme "itself paved the way for eventual ballooning of fiscal spending"Source: Shirakawa 2011, speech of 16 June 2011 (opens in a new tab). We do not choose between the two views.
Japan paid for the war with bonds. The central government's bond issues rose from ¥1 billion (number 58a: where it comes from) in 1935 to ¥33 billion (number 59a: where it comes from) in 1945. After the war, the Reconstruction Finance Bank was "funded mainly by selling bonds to the Bank of Japan", until it was suspended in 1949, as part of the Dodge planSource: Hoshi and Kashyap 2001, Corporate Financing and Governance in Japan, pp. 64, 74; a book, listed in the methods' sources (opens in a new tab).
We judge that money created for the state was behind the destroyed monies the sources studied, but that such money did not always destroy a money. A dated act of government does not tell the two kinds apart. Each episode above in which the money was not destroyed ended with such an act: Japan's inflation crises, for example, ended with the Dodge plan of 1949. So did Germany's episode, in which the paper mark was destroyed: it ended with the decree of 1923.
How did a money hold its value, and how did its backing end?
How did a backing end or fail?
We judge that a backing did not guarantee a money's safety, because it could end or fail in four ways: it was suspended in war, kept in law while prices doubled, broken when the state's debts pressed on it, or given up outside a world war.
First, a backing could be suspended in war. In the First World War, countries stopped exchanging their money for gold, or at least banned the export of gold for a time, in law or in practice. In Eichengreen and Flandreau's words, that is what made "money creation and inflation" possibleSource: Eichengreen and Flandreau 2008, printed p. 7 (opens in a new tab).
Go deeperWhy the gold standard allowed a pause in war
Under the gold standard, a country kept its money exchangeable for a fixed amount of gold "except in the event of a well understood emergency such as a major war". In such a war it might stop exchanging its money for gold, and issue paper money to pay for the warSource: Bordo and Rockoff 1995, pp. 4–5 (opens in a new tab).
Second, a backing could stay in the law while prices doubled. The United States did not leave gold in 1917, but it banned gold exports by a proclamation, from the 7th of September 1917 until the 7th of June 1919. By August 1917, before the ban, US consumer prices were already 1.3 (number 60a: where it comes from) times their level of 1914, while gold could still leave the country. Gold had flowed into the country from early 1915 until the flow slackened in late 1916, and the country's gold holdings grew by more than a billion dollars in the three years to 1917Source: Federal Reserve Board 1917, Fourth Annual Report, pp. 8, 20 (opens in a new tab). In 1920 consumer prices were 2.0 (number 61a: where it comes from) times their level of 1914Source: Federal Reserve Bulletin 1919, October 1919, p. 918; listed in the methods' sources (opens in a new tab)Source: Federal Reserve Board 1917, Fourth Annual Report, p. 21 and pp. 184–185 (opens in a new tab).
Britain kept the gold standard in law for the whole war, behind a fixed exchange rateSource: Moggridge 1972, p. 17; a book, listed in the methods' sources (opens in a new tab). Meanwhile its consumer prices in 1918 reached 2.0 (number 62a: where it comes from) times their level of 1914Source: Jordà, Schularick and Taylor, Macrohistory Database R6, United Kingdom, consumer prices, 1914 and 1918 (opens in a new tab).
Third, a backing could be broken when the state's debts pressed on it. France's mandat of 1796 was legal tender, to be accepted at the same value as coin. It could also be exchanged for national land at fixed prices. Its issue was capped at 2,400 (number 63a: where it comes from) million in face value, and the notes issued never went beyond the cap. Even so, the mandat lost most of its value within months: it fell from 35% (number 64a: where it comes from) of its face value in March to 6% (number 65a: where it comes from) by early summer, while the state still accepted it at its face value. From August the state no longer accepted it at its face value for taxes or land, and on the 4th of February 1797 it was withdrawnSource: Sargent and Velde 1995, p. 510 (opens in a new tab). The cap held, but the cap alone did not protect the mandat's value.
Go deeperHow Argentina's currency board broke
Argentina's currency board broke too. Its law allowed up to a third of its reserves to be held in the state's own bonds, issued in dollars. In April 2001 the law was changed: the central bank could now lend to banks without limit, taking the state's bonds as security. In effect, this ended the board's rule for issuing money. In January 2002 the board collapsed. Consumer prices rose 41% (number 66a: where it comes from) over 2002Source: de la Torre, Levy Yeyati and Schmukler 2003, pp. 3–4, 10–11, 16 (opens in a new tab).
Fourth, a backing could be given up outside a world war. In the countries that left gold after 1931, price levels stabilised by 1933, with mild inflation after. Countries that cut their money's value in gold earlier saw their industrial production recover fasterSource: Eichengreen and Sachs 1985, pp. 7, 9 (opens in a new tab).
From 1932 to 1934, consumer prices did not rise clearly faster in the countries that left gold than in those that stayed. The gap was about 3.8 (number 67a: where it comes from) percentage points a year, but it could have been below zero or as large as about 11 (number 68a: where it comes from) points: the data rule out only a larger gap (the case study on leaving gold). The central estimate points the same way as Bernanke and James's wholesale prices, but with so few economies the data cannot measure the gap precisely.
Our case studyConsumer prices after leaving goldFrom 1932 to 1934, prices did not rise clearly faster where countries left gold than where they stayed: the gap was 3.8 points a year, between -3.1 and 11.Bernanke and James's economies, from 1932 to 1934, on the Macrohistory Database
Did leaving gold make consumer prices rise much faster than staying on it? This case compares consumer-price inflation in the economies that left gold with inflation in those that stayed. The gap was 3.8 (number 67b: where it comes from) points a year, with a margin of error from -3.1 (number 69a: where it comes from) to 11 (number 68b: where it comes from). It rules out a gap larger than about 11 (number 68c: where it comes from) points a year. Bernanke and James measured wholesale prices. This case adds consumer prices, which point the same way, without measuring the gap precisely.
Consumer prices after leaving gold, 1932-34
leavers' inflation less stayers', points a year; 1932-1934; Bernanke and James's economies in JST

The difference in yearly consumer-price inflation between the economies off gold and those on it, 1932-34, with its range: wide, from below zero to about eleven points.
Data table
| what | estimate | low | high |
|---|---|---|---|
| leavers less stayers | 3.7723334879926815 | -3.1470613828440586 | 10.691728358829423 |
Method, data and code for this case study (opens in a new tab)
On the 15th of August 1971 the United States stopped exchanging dollars for gold: in Bordo's words, it closed its "gold window". That step ended a key part of the Bretton Woods system. The system's fixed but adjustable exchange rates were gone by 1973. Bordo traces the end to faster inflation in the world, which came in large part from faster inflation in the United StatesSource: Bordo 1992, pp. 1, 51–53, 55 (opens in a new tab).
In Bordo's words, the collapse "was triggered by an acceleration in world inflation". In the United States, money growth had risen step by step from the early 1960s, partly to pay for the Vietnam war and social programmesSource: Bordo 1992, pp. 51–53, 55 (opens in a new tab).
Go deeperWhy people kept wanting dollars after the link to gold was cut
A paper money does not fail just because it is paper. People kept wanting dollars after the link to gold was cut. As we see it, the reasons to want them had not gone away: taxes and debts in the United States were still owed in dollars, and the dollar kept its place in world trade and in reserves (what makes a money strong abroad). US inflation, already rising before 1971, came down after 1979, when the Fed changed its method and let interest rates rise high (what restrains a paper money). Behind most of the destroyed monies that the sources studied, and perhaps behind all of them, was a state paying for its spending with money created for it.
Inflation crises happened in every era
After July 1971, new inflation crises began less often than before 1914, but monies spent more of their years in one, so we judge that the later crises lasted longer on average. That judgement is worked out from the two figures, across monies that differ from era to era; it does not measure how long each crisis lasted. Inflation crises are not new: most monies with a price record had at least one (the crisis count). The table counts, for each era, how many new inflation crises began for every hundred years of a money's record. Ten monies with prices for ten years each make a hundred such years. The table also gives the share of those years spent in an inflation crisis.
Table, 3 rowsInflation crises happened in every era
| Era | New inflation crises, for every hundred years of record | Share of years spent in an inflation crisis |
|---|---|---|
| Before 1914 | 4.6 (number 70a: where it comes from) | 6.9% (number 71a: where it comes from) |
| 1914 to July 1971 | 2.9 (number 72a: where it comes from) | 11.0% (number 73a: where it comes from) |
| After July 1971 | 2.2 (number 74a: where it comes from) | 13.8% (number 75a: where it comes from) |
On consumer prices alone, the order holds too. New crises: 3.7 (number 76a: where it comes from) for every hundred years of record before 1914, against 2.2 (number 77a: where it comes from) after July 1971. Years in a crisis: 5.2% (number 78a: where it comes from) against 13.8% (number 79a: where it comes from).
Two cautions apply. The three eras are dates, and each mixes several monetary systems. And the monies counted are not the same from one era to the next: there are far more after July 1971 than before 1914, many of them belonging to new states.
Our case studyHow often inflation crises began, and how many years were spent in oneAfter July 1971, new inflation crises began less often than before 1914, but monies spent more of their years in one: 13.8% of their years, against 6.9%.Every money with a price record, from 1800 to 2025, each monetary union counted once. Crises with no datable start are left out of the count of crises begun, but not of the years spent in a crisis.
How often did a new inflation crisis begin, and in which era? Each inflation crisis is counted once, in the era in which it began. The count uses consumer prices where they were kept, and commodity or wholesale prices before that.
How often a new inflation crisis began
crises of 20% or more in a year begun, per 100 money-years with a reading; 1800-2025; every money with a price reading, the euro and each union once
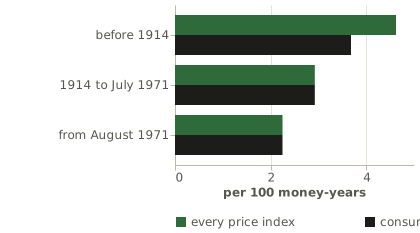
Crises of prices rising 20% or more in a year, each counted once at its start, per 100 years of readings, before 1914, from 1914 to July 1971 and from August 1971; beside them, the count on consumer prices alone.
Data table
| span | variant | rate |
|---|---|---|
| before 1914 | every price index | 4.6252 |
| 1914 to July 1971 | every price index | 2.9258 |
| from August 1971 | every price index | 2.2494 |
| before 1914 | consumer prices only | 3.6826 |
| 1914 to July 1971 | consumer prices only | 2.9255 |
| from August 1971 | consumer prices only | 2.2494 |
Table, 3 rowsHow often inflation crises began, and how many years were spent in one
| Era | Inflation crises begun | Years of record, one per money per year | Share of those years in an inflation crisis | Monies counted | Share of monies with at least one inflation crisis |
|---|---|---|---|---|---|
| Before 1914 | 166 (number 80a: where it comes from) | 3,589 (number 81a: where it comes from) | 6.9% (number 71b: where it comes from) | 43 (number 82a: where it comes from) | 77% (number 83a: where it comes from) |
| 1914 to July 1971 | 101 (number 84a: where it comes from) | 3,452 (number 85a: where it comes from) | 11.0% (number 73b: where it comes from) | 100 (number 86a: where it comes from) | 57% (number 87a: where it comes from) |
| From August 1971 | 158 (number 88a: where it comes from) | 7,024 (number 89a: where it comes from) | 13.8% (number 75b: where it comes from) | 168 (number 90a: where it comes from) | 58% (number 91a: where it comes from) |
The table shows how the number of monies counted changed: 43 (number 82b: where it comes from) before 1914 and 168 (number 90b: where it comes from) after July 1971. Before 1900 most prices were recorded once a year, and many are commodity prices, which rise and fall more than consumer prices. The count on consumer prices alone is given above. The count covers inflation crises, not recoveries from them. Recoveries are told as cases in the text.
For the dollar, the count finds no inflation crisis since 1920.
Method, data and code for this case study (opens in a new tab)
Go deeperHow Rome's silver coins and China's paper money lost their value
Every era had inflation crises. Metal monies had them, as Rome's didSource: Harper 2016, People, Plagues, and Prices in the Roman World, pp. 810, 816, 817; listed in the methods' sources (opens in a new tab). So did paper monies, as China's didSource: von Glahn 1996, Fountain of Fortune, p. 74, note 85; pp. 77–78; a book, listed in the methods' sources (opens in a new tab).
Rome's money was a silver coin of a set weight, and it kept its value as long as the coin kept its silver. Augustus's denarius held about 3.8 (number 92a: where it comes from) grams of silver, and Nero's reform cut that to about 2.76 (number 93a: where it comes from)Source: Butcher and Ponting 2014, The Metallurgy of Roman Silver Coinage, Table 19.4; a book, listed in the methods' sources (opens in a new tab).
A later Roman silver coin, the antoninianus, held about 1.5 (number 94a: where it comes from) grams of silver in the middle of the third century. Two decades later it held almost none. Then Aurelian's reform failed, and prices in Egypt rose ten times over. Harper's evidence for this is records written in Egypt at the timeSource: Harper 2016, People, Plagues, and Prices in the Roman World, pp. 810, 816, 817; listed in the methods' sources (opens in a new tab). In China, the Ming dynasty's paper money, the baochao, could not be exchanged for metal. By 1425, around the end of the Yongle emperor's reign, it circulated at less than 2% (number 95a: where it comes from) of its face valueSource: von Glahn 1996, Fountain of Fortune, p. 74, note 85; pp. 77–78; a book, listed in the methods' sources (opens in a new tab).
Go deeperAn inflation crisis while Britain's paper pound still held its full value in gold
A paper money still worth its full value in gold could have an inflation crisis too. In 1800 the harvests failed in Britain, and its consumer prices rose 32% (number 96a: where it comes from) in Reinhart and Rogoff's data. That year the paper pound was still worth its full value in gold. It fell below that value from 1801 and was back at it in 1821Source: Tooke 1838, A History of Prices, vol. 1, pp. 216–217, 229; vol. 2, p. 379 (opens in a new tab).
Go deeperItaly, Japan and Britain after the oil shock: inflation crises, and no money destroyed
In the 1970s the lira, the yen and the pound had inflation crises, and none was destroyedSource: Hoshi and Kashyap 2001, pp. 220–221, 225; a book, listed in the methods' sources (opens in a new tab). The oil shock of 1973 and 1974 struck all three countries. The crisis count finds crises of this kind in every era.
In 1973 the Bank of Italy provided 5,100 (number 97a: where it comes from) billion lire of the money needed to cover a deficit of 7,540 (number 98a: where it comes from) billion lireSource: BIS 1974, 44th Annual Report, p. 62 (opens in a new tab). In August 1974 Italy's consumer prices were up 20% (number 99a: where it comes from) on the yearSource: IMF IFS, consumer prices, Italy, through DBnomics; the price panel in the methods (opens in a new tab). In 1974 Japan's inflation rose to more than 20% (number 100a: where it comes from). From 1965 to 1974, financial institutions bought government bonds, and the Bank of Japan later bought 95% (number 101a: where it comes from) of those bondsSource: Hoshi and Kashyap 2001, pp. 220–221, 225; a book, listed in the methods' sources (opens in a new tab). Britain's consumer prices rose 22.7% (number 102a: where it comes from) in 1975Source: BIS, long consumer-price series, United Kingdom, 1975 (opens in a new tab).
Did prices rise faster under paper than under gold?
On average, prices were flat under gold and rose a few percentage points a year under paper. In seventeen rich economies from 1870 to 2020, consumer prices rose 0.1% (number 103a: where it comes from) a year on average in the years when their money could be exchanged for gold (in a few early years, for silver). In paper years, they rose 3.7% (number 104a: where it comes from) a year. Both averages leave out the world-war years, the fixed-rate years of 1946 to 1971, and the years with inflation above a hundred per cent, which are counted separately (the case study on gold and paper).
Two limits change what these averages mean. First, no year after 1938 counts as a gold year here. So the gold years are all early and the paper years mostly later, and the gap may come partly from the period, not only from the kind of money. Second, the seventeen economies are today's rich ones. Their currencies did well. So the paper average is lower than it would be for paper money in general (how the averages were made (opens in a new tab)).
Go deeperWhy flat prices under gold fit the record of backings that ended
These averages (how they were made (opens in a new tab)) do not contradict the record of the backings above. Gold kept prices flat on average, but countries suspended it, or kept it only in law behind a ban on gold exports, in the years of greatest pressure: the wars. The averages also hide large changes from year to year. In Britain and the United States, prices and real output were less stable in the short run under gold than after 1945Source: Bordo 1981, Federal Reserve Bank of St. Louis Review, May 1981, p. 14, Table 1, and p. 15 (opens in a new tab).
Our case studyPrices under a metal standard and under paperConsumer prices in seventeen rich economies rose 0.1% a year on average under metal and 3.7% under paper, without the world wars, fixed rates and years above a hundred per cent.Seventeen rich economies, from 1870 to 2020, on the Macrohistory Database
Did prices rise faster under paper than under a metal standard? On average, prices rose 3.6 (number 105a: where it comes from) percentage points a year faster in paper years, with a margin of error from 1.9 (number 106a: where it comes from) to 5.7 (number 107a: where it comes from) points a year. The gap is the paper years' average less the gold years' average, which was close to zero. The picture changes by era. Before 1914, the few paper years were as flat as the gold years: 0.3% (number 108a: where it comes from) against 0.4% (number 109a: where it comes from) a year. Between the wars, prices changed on average by 2.7% (number 110a: where it comes from) a year in paper years, and by -1.6% (number 111a: where it comes from) in gold years. A minus sign means that prices fell. The fixed-rate years of 1946 to 1971 averaged 5.2% (number 112a: where it comes from), and the paper years since 1972 averaged 4.4% (number 113a: where it comes from). These figures average the years of seventeen economies, so they differ from any one money's loss in the first case study.
Prices under a metal standard and under paper
mean consumer-price inflation, % a year; 1870-2020; 17 rich economies; war, 1946-71 and over-100% years apart
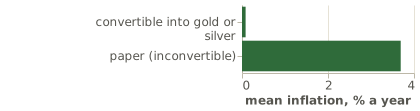
Average yearly consumer-price inflation over economy-years classed by Bordo and Schwartz's chronology, without the years above 100% inflation.
Data table
| years | mean |
|---|---|
| convertible into gold or silver | 0.08506957966351786 |
| paper (inconvertible) | 3.693000737291814 |
Method, data and code for this case study (opens in a new tab)
What restrains a paper money?
In theory, a paper money is restrained by a central bank that raises interest rates by more than each rise in inflation, and a target written on paper does not make a central bank do so. A price target or a mandate is not a commitment like gold. A country leaves gold by a visible act, but no act announces that a target has been given up, so whether a target is kept shows only in the results. In the standard model, if a central bank raises its interest rate by more than each rise in inflation, prices cannot rise just because people expect them to rise. The model shows this for inflation close to the rate the central bank aims atSource: Woodford 2003, ch. 1 and ch. 4; a book, listed in the methods' sources (opens in a new tab). The rule concerns the central bank's usual way of responding, not the level of its rates in any one year.
The rule also needs public finances that support it. In theory, without that support, a central bank that brings inflation down today must accept more inflation later. The reason is that the state's debts must be paid either from its budget surpluses or with newly created money. Sargent and Wallace called this problem "unpleasant monetarist arithmetic"Source: Walsh 2010, Monetary Theory and Policy, 3rd ed., ch. 4, the passage on equation 4.13; a book, listed in the methods' sources (opens in a new tab).
Go deeperHow the Fed changed its method, and how its key interest rate and US prices moved afterwards
In October 1979 the Fed changed its method to slow the growth of money, putting more weight on the supply of bank reserves (the money that banks hold at the central bank)Source: Federal Reserve Bulletin 1979, October 1979, 'Monetary Policy Actions', p. 830 (opens in a new tab). Goodfriend and King give two readings of this change: a new way to control money, or a new willingness to keep interest rates high. On the second reading, the change left the Fed free to raise interest rates as far as needed "to break the inflation"Source: Goodfriend and King 2005, 'The Incredible Volcker Disinflation', NBER w11562, p. 27 (opens in a new tab).
After the switch, the Fed's key interest rate (the federal funds rate) was "clearly both higher and more volatile": it was higher, and it moved up and down moreSource: Walsh 2010, Monetary Theory and Policy, 3rd ed., the section on operating procedures; a book, listed in the methods' sources (opens in a new tab). US consumer prices were up 14.8% (number 114a: where it comes from) on the year in March 1980, and up 3.8% (number 115a: where it comes from) in December 1983Source: BLS, CPI-U, all items, not seasonally adjusted (CUUR0000SA0), twelve-month changes (opens in a new tab).
Go deeperTwo readings of US inflation before the Fed changed its method
Two readings are given for the higher US inflation before 1979. Clarida and co-authors' estimates of the Fed's rule find that the rule described above (the Taylor principle) "has been satisfied by post-1979 policy but not by previous policy". Taylor argued that the failure before 1979 "may well have been responsible for the greater U.S. macroeconomic instability during the 1960s and 1970s"Source: Woodford 2003, ch. 1, note 39; ch. 4; a book, listed in the methods' sources (opens in a new tab). Orphanides read those decades differently. In his analysis, the Fed followed a rule much like its later one. But in the 1970s it kept overestimating how much the economy could produce without pushing up inflation, and so policy tended to let inflation riseSource: Woodford 2003, Interest and Prices, ch. 2, note 29, reporting Orphanides; a book, listed in the methods' sources (opens in a new tab).
Go deeperHow Britain went from targets for money to a central bank setting rates on its own
Britain tried targets for the growth of money first, and a central bank setting interest rates on its own later. In 1980 it put monetary targets at the centre of its economic plan, the Medium-Term Financial StrategySource: Bordo, Bush and Thomas 2025, PDF pp. 29, 59 (opens in a new tab). The Bank of England has set interest rates on its own since May 1997, and the law that gives it this power came into force in June 1998Source: Rodgers 1998, Quarterly Bulletin 1998 Q2, p. 1 (opens in a new tab).
Go deeperWhy some doubt that targets themselves did the work
Some doubt that targets themselves did the work. Ball and Sheridan found no evidence that inflation targeting improved economic performance in the mostly rich economies of the OECD, once they allowed for the fact that countries with unusually bad results tend to improve anywaySource: Ball and Sheridan 2003, p. 2 (opens in a new tab). Across rich economies, more independent central banks go with lower inflation. Romer finds this relationship "striking", but adds that "its ultimate implications remain to be determined"Source: Romer 1996, ch. 9; a book, listed in the methods' sources (opens in a new tab). Blanchard warns that it shows "correlation, not necessarily causality"Source: Blanchard 2017, Macroeconomics, Figure 21-3 and its note; a book, listed in the methods' sources (opens in a new tab).
Turkey shows that a target on paper does not decide what a central bank does. Turkey adopted formal inflation targeting at the start of 2006Source: Yilmaz 2006, speech of 28 April 2006, p. 1 (opens in a new tab). Yet from September 2021 its central bank cut its main interest rate to well below inflation, and it began cutting again in August 2022.
Go deeperHow far Turkey's interest rate and prices moved
From September 2021 the central bank cut its main interest rate, from 19% (number 116a: where it comes from) in August to 14% (number 117a: where it comes from) by DecemberSource: BIS, central bank policy rates, Türkiye, monthly, August and December 2021 (opens in a new tab). In September 2021, consumer prices were up 19.6% (number 118a: where it comes from) on a year earlierSource: BIS, consumer prices, Türkiye, September 2021, year on year (opens in a new tab).
In 2022, consumer prices, averaged over the year, were 72% (number 119a: where it comes from) higher than in 2021. Even so, the central bank "initiated a rate-cut cycle in August", and brought its main rate down to 9% (number 120a: where it comes from) by November. Its stated aim was "to sustain the structural gains in industrial production and employment"Source: Kavcıoğlu 2023, the governor's words (opens in a new tab)Source: OECD 2023, Economic Surveys: Türkiye 2023, PDF p. 12 (opens in a new tab).
In June 2023 the central bank changed direction, and its rate rose in steps, from 8.5% (number 121a: where it comes from) in May 2023 to 50% (number 122a: where it comes from) by March 2024Source: BIS, central bank policy rates, Türkiye, monthly (opens in a new tab). Averaged over each year, consumer prices rose 59% (number 123a: where it comes from) in 2024 and 35% (number 124a: where it comes from) in 2025Source: BIS, long consumer-price series, Türkiye, yearly averages (opens in a new tab).
What makes a money strong abroad?
Over decades, exchange rates follow the gap between one money's inflation and another's, but slowlySource: Rogoff 1996, The Purchasing Power Parity Puzzle, pp. 647–648; listed in the methods' sources (opens in a new tab).
When an exchange rate drifts away from where that gap would put it, half of the drift disappears within three to five years, in the estimates on which most economists agreeSource: Rogoff 1996, The Purchasing Power Parity Puzzle, pp. 647–648; listed in the methods' sources (opens in a new tab).
A money can lead the world's monies with no backing: no metal stands behind the dollar, yet far more of world trade is priced in dollars than is sold to the United States. In the authors' data, which cover more than a hundred countries and about three-quarters of the world's exports, 23% (number 125a: where it comes from) of exports are priced in dollars once commodities are left out, against 10% (number 126a: where it comes from) that go to the United StatesSource: Boz et al. 2020, Patterns in Invoicing Currency in Global Trade, abstract, section 2.5 and section 2.6.1, p. 15 and Figure 4; listed in the methods' sources (opens in a new tab). At the end of 2024 the dollar's share of the world's official foreign-exchange reserves was 57.8% (number 127a: where it comes from)Source: ECB 2025, The international role of the euro, June 2025, section 1.1 (opens in a new tab)Source: ECB 2026, June 2026, section 1.1 and Chart 4 (opens in a new tab).
Eichengreen, Chiţu and Mehl find that since Bretton Woods ended, central banks choosing a reserve currency have given more weight to habit and to the credibility of a currency's policy. They appear to have given less weight to the size of the issuer's economySource: Eichengreen, Chiţu and Mehl 2016, 'Stability or Upheaval?', IMF Economic Review 64(2), pp. 354, 362; listed in the methods' sources (opens in a new tab).
No money keeps the leading place forever. The dollar itself first replaced sterling as the leading reserve currency in the mid-1920sSource: Eichengreen and Flandreau 2009, European Review of Economic History 13(3), p. 379; pp. 394, 396 (opens in a new tab). Who might succeed the dollar is the subject of another study.
Is a stronger money a better one? The Swiss franc
The Swiss franc has risen against the dollar since 1970. More than half of that rise came from Switzerland's lower inflation. The rest was a real rise. Against Switzerland's trading partners together, an even larger share of the franc's rise came from lower Swiss inflation (the case study on the franc).
Our case studyThe franc at home and abroadFrom 1970 to 2025 the franc rose 165 log points against the dollar: 96 from Switzerland's lower inflation and 68 from a real rise.The franc against the dollar and against its trading partners, from 1970 to 2025, on BIS data
How much of the franc's rise came from lower inflation in Switzerland, and how much was a real rise? The case splits each rise in the franc's exchange rate into two parts. One part is the gap between Swiss inflation and inflation on the other side. The other part is what remains: the real rise. From 1970 to 2025 the franc rose 165 (number 128a: where it comes from) log points against the dollar. Of these, 96 (number 129a: where it comes from) came from the inflation gap and 68 (number 130a: where it comes from) from the real rise. Each part is rounded, so the two may not add up exactly to the total.
The franc, nominal and real, since 1970
the franc's exchange rate, nominal and real, index, 1970 = 100; 1970-2025; the Swiss franc
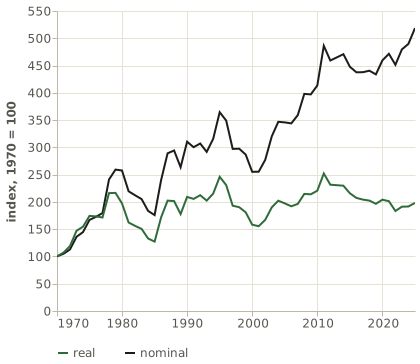
The franc in dollars, and against its trading partners (the BIS's narrow basket), each nominal and real (adjusted for the gap between Swiss and foreign consumer prices), as an index with 1970 = 100. The space between the nominal and the real line is Switzerland's lower inflation.
Data table
| year | basis | rate | index |
|---|---|---|---|
| 1970 | against the dollar | nominal | 100.0 |
| 1971 | against the dollar | nominal | 104.69 |
| 1972 | against the dollar | nominal | 112.87 |
| 1973 | against the dollar | nominal | 136.01 |
| 1974 | against the dollar | nominal | 144.63 |
| 1975 | against the dollar | nominal | 166.85 |
| 1976 | against the dollar | nominal | 172.52 |
| 1977 | against the dollar | nominal | 179.36 |
| 1978 | against the dollar | nominal | 240.95 |
| 1979 | against the dollar | nominal | 259.12 |
| 1980 | against the dollar | nominal | 257.47 |
| 1981 | against the dollar | nominal | 219.43 |
| 1982 | against the dollar | nominal | 212.02 |
| 1983 | against the dollar | nominal | 205.13 |
| 1984 | against the dollar | nominal | 183.45 |
| 1985 | against the dollar | nominal | 175.7 |
| 1986 | against the dollar | nominal | 239.94 |
| 1987 | against the dollar | nominal | 289.1 |
| 1988 | against the dollar | nominal | 294.2 |
| 1989 | against the dollar | nominal | 263.51 |
| 1990 | against the dollar | nominal | 310.36 |
| 1991 | against the dollar | nominal | 300.16 |
| 1992 | against the dollar | nominal | 306.98 |
| 1993 | against the dollar | nominal | 291.61 |
| 1994 | against the dollar | nominal | 315.53 |
| 1995 | against the dollar | nominal | 364.33 |
| 1996 | against the dollar | nominal | 348.92 |
| 1997 | against the dollar | nominal | 297.11 |
| 1998 | against the dollar | nominal | 297.48 |
| 1999 | against the dollar | nominal | 286.64 |
| 2000 | against the dollar | nominal | 255.05 |
| 2001 | against the dollar | nominal | 255.33 |
| 2002 | against the dollar | nominal | 276.89 |
| 2003 | against the dollar | nominal | 320.13 |
| 2004 | against the dollar | nominal | 346.86 |
| 2005 | against the dollar | nominal | 345.75 |
| 2006 | against the dollar | nominal | 343.8 |
| 2007 | against the dollar | nominal | 359.15 |
| 2008 | against the dollar | nominal | 397.87 |
| 2009 | against the dollar | nominal | 397.09 |
| 2010 | against the dollar | nominal | 413.39 |
| 2011 | against the dollar | nominal | 486.04 |
| 2012 | against the dollar | nominal | 459.15 |
| 2013 | against the dollar | nominal | 464.8 |
| 2014 | against the dollar | nominal | 470.76 |
| 2015 | against the dollar | nominal | 447.63 |
| 2016 | against the dollar | nominal | 437.45 |
| 2017 | against the dollar | nominal | 437.72 |
| 2018 | against the dollar | nominal | 440.44 |
| 2019 | against the dollar | nominal | 433.72 |
| 2020 | against the dollar | nominal | 459.29 |
| 2021 | against the dollar | nominal | 471.39 |
| 2022 | against the dollar | nominal | 451.25 |
| 2023 | against the dollar | nominal | 479.44 |
| 2024 | against the dollar | nominal | 489.59 |
| 2025 | against the dollar | nominal | 518.63 |
| 1970 | against the dollar | real | 100.0 |
| 1971 | against the dollar | real | 106.97 |
| 1972 | against the dollar | real | 119.12 |
| 1973 | against the dollar | real | 147.03 |
First 60 of 224 rows. The full table is in the download.
Against Switzerland's trading partners together, measured by the BIS's narrow effective rate, the franc rose 156 (number 131a: where it comes from) log points from 1970 to 2025. Of these, 108 (number 132a: where it comes from) came from the inflation gap and 48 (number 133a: where it comes from) were a real rise.
Swiss exports went from 38% (number 134a: where it comes from) of GDP in 1971 to 78% (number 135a: where it comes from) in 2025, while the franc rose. The chart only shows the two figures side by side. It does not say why exports moved. What a stronger franc did to exporters is a separate question, and the studies we read answer it only for 2015.
Swiss exports beside the real franc
exports of goods and services; the real effective rate, % of GDP; index, 1970 = 100; 1971-2025; Switzerland
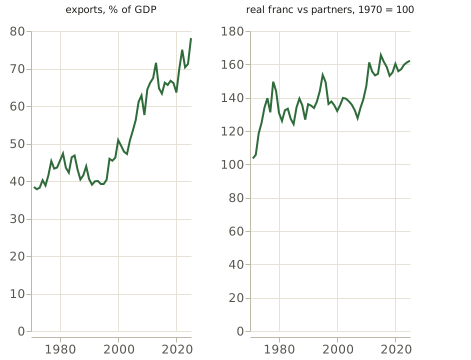
Top: exports of goods and services as a share of Swiss GDP. Bottom: the franc's real effective exchange rate against its trading partners (narrow basket), 1970 = 100. No line is fitted and no correlation is computed.
Data table
| year | series | value |
|---|---|---|
| 2025 | exports, % of GDP | 78.1 |
| 2024 | exports, % of GDP | 71.2 |
| 2023 | exports, % of GDP | 70.3 |
| 2022 | exports, % of GDP | 75.0 |
| 2021 | exports, % of GDP | 69.9 |
| 2020 | exports, % of GDP | 63.6 |
| 2019 | exports, % of GDP | 66.1 |
| 2018 | exports, % of GDP | 66.7 |
| 2017 | exports, % of GDP | 65.6 |
| 2016 | exports, % of GDP | 66.2 |
| 2015 | exports, % of GDP | 63.3 |
| 2014 | exports, % of GDP | 64.7 |
| 2013 | exports, % of GDP | 71.5 |
| 2012 | exports, % of GDP | 67.4 |
| 2011 | exports, % of GDP | 66.2 |
| 2010 | exports, % of GDP | 64.4 |
| 2009 | exports, % of GDP | 57.6 |
| 2008 | exports, % of GDP | 62.8 |
| 2007 | exports, % of GDP | 61.1 |
| 2006 | exports, % of GDP | 56.2 |
| 2005 | exports, % of GDP | 53.4 |
| 2004 | exports, % of GDP | 50.8 |
| 2003 | exports, % of GDP | 47.2 |
| 2002 | exports, % of GDP | 47.8 |
| 2001 | exports, % of GDP | 49.4 |
| 2000 | exports, % of GDP | 50.9 |
| 1999 | exports, % of GDP | 46.2 |
| 1998 | exports, % of GDP | 45.4 |
| 1997 | exports, % of GDP | 45.9 |
| 1996 | exports, % of GDP | 40.3 |
| 1995 | exports, % of GDP | 39.2 |
| 1994 | exports, % of GDP | 39.2 |
| 1993 | exports, % of GDP | 40.0 |
| 1992 | exports, % of GDP | 39.9 |
| 1991 | exports, % of GDP | 39.0 |
| 1990 | exports, % of GDP | 40.5 |
| 1989 | exports, % of GDP | 43.9 |
| 1988 | exports, % of GDP | 41.5 |
| 1987 | exports, % of GDP | 40.4 |
| 1986 | exports, % of GDP | 43.1 |
| 1985 | exports, % of GDP | 46.8 |
| 1984 | exports, % of GDP | 46.3 |
| 1983 | exports, % of GDP | 42.2 |
| 1982 | exports, % of GDP | 43.5 |
| 1981 | exports, % of GDP | 47.3 |
| 1980 | exports, % of GDP | 45.4 |
| 1979 | exports, % of GDP | 43.6 |
| 1978 | exports, % of GDP | 43.3 |
| 1977 | exports, % of GDP | 45.3 |
| 1976 | exports, % of GDP | 41.5 |
| 1975 | exports, % of GDP | 38.8 |
| 1974 | exports, % of GDP | 40.2 |
| 1973 | exports, % of GDP | 38.2 |
| 1972 | exports, % of GDP | 37.8 |
| 1971 | exports, % of GDP | 38.4 |
| 1971 | real franc vs partners, 1970 = 100 | 103.49 |
| 1972 | real franc vs partners, 1970 = 100 | 105.78 |
| 1973 | real franc vs partners, 1970 = 100 | 118.56 |
| 1974 | real franc vs partners, 1970 = 100 | 124.95 |
| 1975 | real franc vs partners, 1970 = 100 | 134.1 |
First 60 of 110 rows. The full table is in the download.
Method, data and code for this case study (opens in a new tab)
Switzerland's own central bank did not treat a stronger franc as a better one: it judged a stronger franc harmful, and from September 2011 to January 2015 it did not let the franc rise above a set level against the euro. The set level was 1.20 (number 136a: where it comes from) francs per euro: the Swiss National Bank would not let one euro buy fewer francs than thatSource: BIS 2011, BIS Quarterly Review, September 2011, p. 13; listed in the methods' sources (opens in a new tab)Source: Jordan 2015, introductory remarks, 15 January 2015 (opens in a new tab)Source: Jordan 2015, speech of 24 April 2015 (opens in a new tab).
Go deeperWhat happened when the Swiss National Bank let the franc rise
When the Swiss National Bank dropped its set level in January 2015, the stronger franc made imports only slightly cheaper for shoppers, and it put pressure on firms. By the end of 2015, goods bought abroad and priced in euros cost 11.0% (number 137a: where it comes from) less at the border. In shops, imported goods cost only 3.9% (number 138a: where it comes from) less. Switzerland's GDP fell 0.2% (number 139a: where it comes from) in the first three months of 2015. Firms cut their prices to compete with imports. They also made twice as much use of shorter working hours for their staffSource: Auer, Burstein and Lein 2021, pp. 2, 10; Table 3, p. 11 (opens in a new tab)Source: OECD 2015, Economic Surveys: Switzerland 2015, p. 18 (opens in a new tab).
Switzerland feels expensive, but high prices are not the same as the franc losing what it buys at home. The franc loses what it buys when Swiss prices rise over time. Taken over everything each country produces, Switzerland's prices in 2025 were higher than in each of four of its neighbours, from 1.37 (number 140a: where it comes from) times Austria's to 1.62 (number 141a: where it comes from) times Italy's, on the World Bank's comparison of price levels. The chart shows all four.
Switzerland's price level against its neighbours', 2025
GDP price level, Switzerland over each neighbour, times; 2025; Switzerland and its neighbours
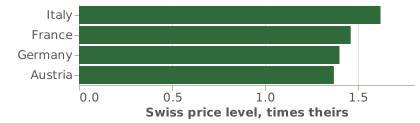
The World Bank's PPP conversion factor for GDP over the market exchange rate gives each country's price level; each bar is Switzerland's divided by a neighbour's.
Data table
| neighbour | ratio |
|---|---|
| Germany | 1.4 |
| France | 1.46 |
| Italy | 1.62 |
| Austria | 1.37 |
When prices are converted into one currency at market exchange rates, rich countries tend to have higher prices than poor ones. Rogoff discusses one explanation of this pattern, the Balassa–Samuelson hypothesisSource: Rogoff 1996, p. 658; listed in the methods' sources (opens in a new tab).
How do people see a money's value?
People act on what they expect a money to be worth, and they feel inflation as prices outrunning their pay. Asked why they dislike inflation, people who are not economists most often say that it lowers their standard of living. They seem to assume that wages do not rise with pricesSource: Shiller 1996, pp. 5, 12 (opens in a new tab). Nearly three decades later, people still dislike inflation mainly because they believe it reduces what their money buys: to them, wages do not seem to keep pace with pricesSource: Stantcheva 2024, p. 2 (opens in a new tab).
Once a money has failed people, they do not come back to it quickly. Some countries brought inflation down after their people had turned to the dollar for use at home. In those countries, the use of the dollar generally did not fall muchSource: Reinhart, Rogoff and Savastano 2003, pp. 23, 30, 32 (opens in a new tab). The next study explains why, as people turn away from a money, its prices rise faster than the quantity of notes.
What are things close to money worth?
Bonds, deposits, money-market funds and stablecoins are promises to pay money, or claims that keep a fixed price because that is the usual practice. They are used like money as long as nobody asks what stands behind them. Short-term debts traded between firms, banks and funds work best when their holders do not need to check what stands behind them. Holmström calls this state "no questions asked". In his reading, crises end when markets return to that stateSource: Holmström 2015, BIS Working Paper 479, pp. 1, 8, 22 (opens in a new tab).
Things close to money, from deposits to stablecoins, are worth money only as far as what stands behind them, or what insures them, is good. When people start to ask what stands behind such a promise, its price moves. In September 2008 the Reserve Primary Fund held debt issued by Lehman Brothers. It cut the value of its shares to 97 (number 142a: where it comes from) cents each, and the fund's holders lost the differenceSource: McCabe 2010, the section on weekly risks and outflows (opens in a new tab).
Stablecoins are no different. In March 2023, the company that issues the stablecoin USDC disclosed that some of its reserves were deposited at the failing Silicon Valley Bank, and USDC fell for a time to 87 (number 143a: where it comes from) centsSource: Federal Reserve 2023, Financial Stability Report, May 2023, p. 55 (opens in a new tab).
Go deeperTerraUSD: a stablecoin with no assets held outside the blockchain
Some stablecoins are backed by short-term US government debts and other assets held outside the blockchain (the digital ledger on which the coins are recorded). Another stablecoin, TerraUSD, was not, and it collapsed in three days in May 2022Source: Liu, Makarov and Schoar 2023, pp. 1–3, 12, 28 (opens in a new tab).
TerraUSD rested on a contract: one TerraUSD token could be exchanged for a dollar's worth of a second token from the same system, LUNA. To support this, its backers built a reserve of about 80,300 (number 144a: where it comes from) bitcoin by May 2022. They spent about $2.5 billion (number 145a: where it comes from) trying to defend the token's fixed price of one dollar, before it collapsedSource: Liu, Makarov and Schoar 2023, pp. 1–3, 12, 28 (opens in a new tab).
Do today's monies have the two supports?
On paper, the dollar, the euro, the Swiss franc and the yen have both supports, and only the outcome will show whether their restraint holds. Payments are owed in these currencies by law, and their restraint has a legal form: a mandate that includes stable prices, and a ban on financing the state. For the yen, the ban is a limit that Japan's parliament sets, with exceptions for the state's short-term borrowing and its financing bills. Dollar stablecoins have no floor of their own. They rely on the dollar's floor, and they keep their value only as long as their reserves keep theirs. Gold and bitcoin have no legal floor in these economies.
The table sets today's monies against the two supports. Its middle columns sum up what each money's laws and central bank say. Its last column gives the record, because no table can show whether the restraint will hold.
Table, 7 rowsDo today's monies have the two supports?
| Money | The floor: payments owed in it by law | The restraint's written form | Its record |
|---|---|---|---|
| The dollar | Yes | A mandate in law, and a ban on financing the state | Lost 2.5% (number 6d: where it comes from) a year since 1992 |
| The euro | Yes | A mandate in law, and a ban on financing the state | With the currencies it replaced, lost 1.6% (number 27b: where it comes from) a year in France and 2.0% (number 29b: where it comes from) in Germany since 1992 |
| The Swiss franc | Yes | A mandate in law, and a ban on financing the state | Lost 0.8% (number 22b: where it comes from) a year since 1992 |
| The yen | Yes | A mandate in law, and a limit on financing the state | Lost 0.6% (number 10c: where it comes from) a year since 1992 |
| Dollar stablecoins | No | Reserves required by law | A short record. USDC fell to 87 (number 143b: where it comes from) cents in March 2023 |
| Gold | No | No issuer | Its real price, after inflation, "has fluctuated wildly", and it is "an unreliable inflation hedge" (a poor protection against inflation)Source: Erb and Harvey 2013, pp. 1, 7, 14 (opens in a new tab) |
| Bitcoin | No | A supply that grows by design to a limit of 21 million (number 146a: where it comes from) coinsSource: ECB 2012, Virtual Currency Schemes, PDF pp. 24–25 (opens in a new tab) | Large rises and falls. It lost 77% (number 147a: where it comes from) of its dollar price from November 2021 to November 2022, then passed its 2021 high in March 2024Source: FRED, CBBTCUSD, daily (opens in a new tab) |
For the dollar, the Fed's mandate in law is maximum employment, stable prices and moderate long-term interest ratesSource: Federal Reserve, Federal Reserve Act, section 2A (opens in a new tab).
Go deeperWhat the laws and the central banks say, money by money
- The dollar. US notes are legal tender for debts, taxes and duesSource: Federal Reserve, FAQ on refusing cash; listed in the methods' sources (opens in a new tab). The Fed may buy Treasury debt "only in the open market", not directly from the TreasurySource: Federal Reserve, Federal Reserve Act, section 14, para. (b) (opens in a new tab). It has a 2% (number 7b: where it comes from) goal for inflation, and says it is "prepared to act forcefully"Source: FOMC, Statement on Longer-Run Goals, pp. 1–2 (opens in a new tab).
- The euro. Euro notes and coins are legal tender, and shops are generally obliged to take cashSource: ECB, 'Access to and acceptance of cash' (opens in a new tab). Price stability comes first, under the EU TreatySource: ECB, the Treaty, Article 127, PDF p. 24 (opens in a new tab). The ECB may not lend to governments or buy their debt "directly from them"Source: ECB, Statute, Article 21.1, restating Treaty Article 123, PDF p. 17 (opens in a new tab). It aims at inflation of 2% (number 31b: where it comes from)Source: ECB 2021, monetary policy strategy statement (opens in a new tab). In 2012 the ECB's president pledged to do "whatever it takes" to preserve the euroSource: Draghi 2012, speech in London, 26 July 2012 (opens in a new tab). That was a promise to act, and it does not restrain the issuer.
- The Swiss franc. Coins, notes and francs held at the central bank are legal tenderSource: SNB, 'Legal framework', the Federal Act on Currency and Payment Instruments (opens in a new tab). Price stability is defined as prices rising 0% (number 148a: where it comes from) to 2% (number 149a: where it comes from) a year. The central bank may not lend to the Swiss federal state, nor buy the state's bonds when the state first sells themSource: Schlegel 2025, speech of 25 April 2025 (opens in a new tab)Source: Danthine 2015, footnote 5 (opens in a new tab)Source: Jordan 2023, speech of 27 April 2023 (opens in a new tab).
- The yen. Bank of Japan notes are legal tender, to be used for payment without limitSource: Bank of Japan Act, Act No. 89 of 1997, Article 46, in the Bank of Japan's Functions and Operations, Appendix 1 (opens in a new tab). Price stability is the aim of the Bank's monetary control, under the Bank of Japan Act. Apart from the state's short-term borrowing and its financing bills, the Bank may lend to the state, or buy its bonds when they are issued, only within a limit Japan's parliament decidesSource: Bank of Japan Act, Act No. 89 of 1997, Articles 2 and 34, in the Bank of Japan's Functions and Operations, Appendix 1 (opens in a new tab).
- Dollar stablecoins. The GENIUS Act requires reserves at least equal to the coins, held in cash, deposits and short-term Treasury debts, and coins that can be redeemed on requestSource: GENIUS Act, S. 1582, Sec. 4(a)(1) (opens in a new tab). Judged by the BIS's own tests for a monetary system, stablecoins fall shortSource: BIS 2025, Annual Economic Report 2025, chapter III (opens in a new tab).
We judge that the restraint on the dollar, the euro, the Swiss franc and the yen is how each central bank reacts when inflation rises, with public finances that let it do so, and that its written mandate is the legal form of that restraint. A mandate has not stopped a central bank from owning much of its state's debt: the Bank of Japan, under one, owns nearly half of its state's bonds.
Go deeperThe US debt, the Bank of Japan's bonds, and the ECB's purchases and losses
In the United States, the federal debt held by the public was 99% (number 150a: where it comes from) of GDP in early 2026, against 78% (number 151a: where it comes from) at the end of 2019. In the fiscal year 2025, interest on the debt cost 3.2% (number 152a: where it comes from) of GDPSource: FRED, FYGFGDQ188S and FYOIGDA188S (opens in a new tab).
The Bank of Japan held 54% (number 153a: where it comes from) of Japan's government bonds in September 2023, and 47% (number 154a: where it comes from) in June 2026Source: Bank of Japan 2026, Flow of Funds, second quarter of 2026, Chart 6-2 (2), p. 11 (opens in a new tab). In July 2024 it announced a plan to cut its monthly bond purchases to about ¥3 trillion (number 155a: where it comes from) by early 2026Source: Bank of Japan 2024, statement of July 2024, p. 1 (opens in a new tab).
Since 2022 the ECB can buy the bonds of a member state, with no limit set in advance, when that state's borrowing costs rise for reasons its own economic situation does not explain. In the ECB's words, the rise must be "not warranted by country-specific fundamentals". The state must also meet conditions on its budget and its economySource: ECB 2022, the Transmission Protection Instrument, July 2022 (opens in a new tab).
The ECB lost €7.9 billion (number 156a: where it comes from) in 2024 and €1.3 billion (number 157a: where it comes from) in 2025. It says it can still do the job the law gives it, keeping prices stable, "regardless of any losses"Source: ECB 2026, press release of February 2026 (opens in a new tab). The Federal Reserve's own losses are told in the second part of this series.
What do the episodes in this study say about debt levels like today's? They say something about who lends to the state and about the interest rate, and nothing about how much debt is too much. These are readings of past episodes, not a forecast.
- Who holds the state's debt. In the one case of Japan, a central bank's large share of its state's debt did not, on its own, destroy the money: the Bank of Japan has held about half of its state's bonds in recent years, and the yen has not been destroyed. The study also tells of monies that a central bank financed and whose prices rose fast, but that were not destroyed: the United States in 1946 and 1947, when wartime price controls ended (the dollar after the war), Italy in 1973 and 1974 (the 1970s), and Japan from 1944 to 1949.
- The interest rate against inflation. From September 2021 Turkey's central bank cut its rate to well below inflation, and in 2022 consumer prices rose by nearly three-quarters. After it raised the rate in steps from June 2023, yearly inflation came down to about a third by 2025 (what restrains a paper money). That is one case. It shows the rate and inflation moving at the same time, not which caused which.
- The size of the debt. Neither of the two studies of deficits and inflation that this study reads (Fischer, Sahay and Végh, and Catão and Terrones) gives a level of debt that would matter for the dollar, the euro or the yen. Both measure deficits, not debt.
Go deeperWhat went with the destroyed monies, and what the two studies of deficits found
Late in 1945, Japan's prices came close to Cagan's threshold for a destroyed money. What went with the destroyed monies was money created for the state, in one of the four forms the study describes. Most plainly, a central bank was its state's main or only lender once investors would not buy the state's bonds, as in Bolivia in 1984 (why some monies were destroyed).
Fischer, Sahay and Végh find that deficits explain high inflation, and no clear link where inflation is low. Catão and Terrones find a link across many countries, but not among low-inflation advanced economies (why some monies were destroyed).
How often did an inflation crisis follow high public debt? We counted the years of eighteen rich economies from 1871 to 2017, in three bands of public debt, and set apart the years near the two world wars and three other wars. Near those wars, crises followed more often at every level of debt: within three years of 33 (number 158a: where it comes from) of 184 (number 159a: where it comes from), 19 (number 160a: where it comes from) of 94 (number 161a: where it comes from) and 5 (number 162a: where it comes from) of 46 (number 163a: where it comes from) years, from the lowest band of debt to the highest. Away from those wars, a crisis followed 23 (number 164a: where it comes from) of 1,353 (number 165a: where it comes from) years with debt below 60% (number 166a: where it comes from) of GDP (1.7% (number 167a: where it comes from)), 6 (number 168a: where it comes from) of 462 (number 169a: where it comes from) years from 60% (number 166b: where it comes from) to 100% (number 170a: where it comes from) (1.3% (number 171a: where it comes from)), and 8 (number 172a: where it comes from) of 222 (number 173a: where it comes from) years above 100% (number 170b: where it comes from) (3.6% (number 174a: where it comes from)), in 11 (number 175a: where it comes from) economies. These are counts of the past in eighteen economies that survived (how the count was made (opens in a new tab)). They are not a forecast, and they set no threshold.
Go deeperHow the count was made, the full table with the years near the wars, and the count's other limits
The count uses the Jordà-Schularick-Taylor database. The bands of debt were chosen before counting. A year counts as followed by a crisis when, within the next three years, prices start or restart rising by 20% (number 176a: where it comes from) or more in a year. Years overlap, so one crisis can follow up to three of them. The years of other wars, such as Korea and Vietnam, are counted among the years away from the world wars and the three other wars.
Away from those wars, the count rules out a share of high-debt years followed by a crisis above about 8.7% (number 177a: where it comes from). That bound comes from only 11 (number 175c: where it comes from) economies. Each is resampled whole, with its overlapping years, but so few economies probably make the bound too tight. The years of high debt away from those wars come mostly from Italy, France and Spain before 1914, from Britain, France, Italy and Belgium between the wars, from Britain from 1949 to 1964, and from Belgium, Italy, Japan and Portugal since 1980.
The count has three more limits:
- Some years have no debt figure and are not counted: the 1870s in five economies, Finland before 1914, and years of war and crisis (Germany from 1914 to 1926, France from 1914 to 1919 and from 1939 to 1948, among others). Four crisis beginnings are missed for that reason: France in 1918 and 1942, Belgium in 1920 and Switzerland in 1872.
- The database's debt figure is a wider measure than the debt held by the public quoted above. On it, the United States had debt above 100% (number 170e: where it comes from) of GDP from 2013 to 2020, the database's last year.
- Debt is measured against GDP, which rises with prices. So a year of rising inflation sits in a lower band of debt than it would sit if prices had not risen (how the count was made (opens in a new tab)).
Go deeperWhy bitcoin's value rests on convention alone
On this study's supports, bitcoin has neither a floor nor an issuer to restrain. No one owes anything to the holder of a bitcoin, and no issuer will ever pay out for it. Its value rests only on the expectation that others will accept it. Its supply follows a schedule fixed in advance by its rules, so every change in demand moves its priceSource: BIS 2018, Annual Economic Report 2018, ch. V (opens in a new tab). In the Fed's 2024 survey, 7% (number 178a: where it comes from) of US adults held a cryptocurrency as an investment, and 2% (number 179a: where it comes from) used a cryptocurrency to pay for somethingSource: Federal Reserve 2025, Economic Well-Being of U.S. Households in 2024, pp. 53–54 (opens in a new tab). Whatever value bitcoin has rests on convention alone.
Go deeperA digital euro: proposed, not decided
A digital euro is proposed, not decided. Its regulation is still being negotiated, and the ECB will decide whether to issue it only once the regulation is adoptedSource: ECB, 'Digital euro' FAQ, Q15–Q18 (opens in a new tab). It would be the same money in another form, issued and owed by the same central bank.
Five questions to ask of any money
Five questions can be asked of any money, and the news and public documents can answer them.
- Are payments owed in it by law? Taxes payable in it, and debts settled in it: the floor.
- Who can make more of it, and what stops them? A law, a backing, or a limited quantity. For a paper money, look for a mandate in law for stable prices, a ban on financing the state, what the central bank says, in its own words, it does when inflation rises, and whether the state's public finances let it do so. In theory, the restraint works when the central bank raises interest rates by more than inflation rose, with public finances that support it.
- Is the state paying for its spending with money created for it, in any form? Look for the state's own notes, or loans from the central bank. Look for a promise by the central bank to buy the state's debt at a fixed price or interest rate, or for the central bank spending for the state. Look for banks that buy the state's bonds and then borrow from the central bank against them. Other forms are possible.
- Is there a rival money at hand? A money people can switch to, as Ecuador switched to the dollar.
- Are people quietly switching? Look for people keeping their bank deposits in another money, and for prices given in that other money.
An inflation target written down is not enough to answer the second question. Turkey had such a target.
The next study asks where money comes from, and how money is different from value. The study after that asks what still holds its value when a money loses what it buys.
The studies behind this answer
6
- What a unit of money buys, from 1914 to 2025From 1991 to 2025 a unit lost 17% (number 4d: where it comes from) (yen) to 58% (number 1d: where it comes from) (dollar) of what it bought; a euro 39% (number 5d: where it comes from) in Germany, 1999 to 2025.Six monies, from 1914 to 2025, on the BIS's long series of consumer prices
- What the greenback and the paper pound were worth in goldThe greenback fell to 39% (number 41c: where it comes from) of its value in gold in its lowest month, and was back at full value by the end of 1878. The paper pound, on yearly averages, fell to 75% (number 42b: where it comes from) and was back in 1821.The greenback month by month from 1862 to 1878, and the paper pound year by year from 1800 to 1821
- Consumer prices after leaving goldFrom 1932 to 1934, prices did not rise clearly faster where countries left gold than where they stayed: the gap was 3.8 (number 67c: where it comes from) points a year, between -3.1 (number 69b: where it comes from) and 11 (number 68d: where it comes from).Bernanke and James's economies, from 1932 to 1934, on the Macrohistory Database
- How often inflation crises began, and how many years were spent in oneAfter July 1971, new inflation crises began less often than before 1914, but monies spent more of their years in one: 13.8% (number 75c: where it comes from) of their years, against 6.9% (number 71c: where it comes from).Every money with a price record, from 1800 to 2025, each monetary union counted once. Crises with no datable start are left out of the count of crises begun, but not of the years spent in a crisis.
- Prices under a metal standard and under paperConsumer prices in seventeen rich economies rose 0.1% (number 103b: where it comes from) a year on average under metal and 3.7% (number 104b: where it comes from) under paper, without the world wars, fixed rates and years above a hundred per cent.Seventeen rich economies, from 1870 to 2020, on the Macrohistory Database
- The franc at home and abroadFrom 1970 to 2025 the franc rose 165 (number 128b: where it comes from) log points against the dollar: 96 (number 129b: where it comes from) from Switzerland's lower inflation and 68 (number 130b: where it comes from) from a real rise.The franc against the dollar and against its trading partners, from 1970 to 2025, on BIS data
Get next week's study by email
One email a week with the new study, a few days before it is on LinkedIn.
Help shape the next studiesTwo minutes, anonymous: tell us what worked, or suggest a study
Terms
28
- purchasing power
- What one unit of a money buys at home: the inverse of the price level. When prices double, it halves. Example: If a sandwich cost one unit last year and costs two now, each unit buys half a sandwich: its purchasing power halved.
- exchange rate
- What one unit of a money trades for in another money. The nominal rate is the price you see; the real rate corrects it for the two sides' prices, so it says whether a money truly got dearer abroad. Example: The franc's rate against the dollar is how many dollars one franc buys.
- fiscal theory of the price level
- The theory that a money's value, and the level of prices, are set by the budget surpluses the state is expected to run in all the years ahead. Example: In this theory, if people come to expect smaller surpluses, prices rise even if no new money is printed.
- legal tender
- A money the law says settles a debt when offered. What it obliges a shop to do differs by country. Example: In the United States, cash settles any debt, yet a shop may still refuse it at the till.
- price level
- How much goods and services cost in a money, taken together, at one time. Example: If a basket of groceries costs twice as much as ten years ago, the price level of groceries has doubled.
- greenback
- The paper dollar the Union issued in the American Civil War, not convertible into gold until 1879. Example: A greenback dollar bought less than half a gold dollar at the worst of the war.
- hyperinflation
- Prices rising by half or more in a single month, Cagan's line. At that pace prices double in under two months. Example: Germany in 1923, when prices rose many times over in a month.
- seigniorage
- What a state gains from issuing money. This part counts it as the new money issued (Romer's sense). The second part of the series counts the interest a central bank earns on what it bought with the money it issued. Example: A state that pays its bills with new notes takes seigniorage in this part's sense. A central bank earning interest on bonds bought with its notes takes it in the second part's sense.
- assignats
- The paper money of revolutionary France, first issued against the land the state had seized from the Church. Example: Issued from 1790, the assignats were retired in 1796.
- face value
- The amount printed on a note or a bond. Example: A note printed "ten livres" has a face value of ten livres, whatever it buys.
- mandat
- The paper note France issued in 1796 to retire the assignats and to pay the state's spending. It was legal tender and could be exchanged for national land at fixed prices. Example: A holder of mandats could hand them over for a plot of national land at a price set in advance.
- monetising
- Paying a state's deficit with newly created money: the central bank lending to the state or buying its bonds when they are issued. Example: A central bank that buys the treasury's new bonds with money it creates is monetising the deficit.
- quasi-fiscal
- Spending or losses a central bank takes on for the state, outside the state's own budget. Example: A central bank lending to favoured firms at below-market rates is a quasi-fiscal activity.
- convertibility
- The right to change a note at its issuer for a fixed weight of gold (or silver, or another money). Example: Before 1914, a Bank of England note could be changed at the Bank for a fixed weight of gold.
- yield-curve control
- A central bank's promise to buy as many government bonds as needed to hold a bond's yield at a set level. Example: The Bank of Japan held its ten-year yield near zero this way.
- currency board
- A rule that issues a money only against an equal amount of a foreign money held in reserve, at a fixed rate. Example: Hong Kong issues its dollar only against US dollars held at a fixed rate.
- Bretton Woods system
- The system of fixed but adjustable exchange rates in which the dollar was linked to gold. The link ended in August 1971, and the fixed rates were gone by 1973. Example: Under the Bretton Woods system, a money's rate against the dollar was fixed, though it could be changed.
- money-years
- One money observed for one year. A hundred money-years can be ten monies over ten years, or one money over a century. Example: The dollar observed from 1914 to 1923 counts as ten money-years.
- Taylor principle
- The rule that a central bank raises its interest rate by more than each rise in inflation, so that borrowing grows dearer once inflation is counted. Example: If inflation rises by one point, the central bank raises its rate by more than one point.
- inflation targeting
- A central bank's policy of announcing the inflation it aims for. Example: A central bank says it aims for inflation of about two per cent a year.
- reserve currency
- A money that central banks and governments hold abroad as reserves. Example: The dollar is the largest reserve currency; sterling was the first before it.
- real rise
- The part of a money's rise abroad that is left once the gap between its inflation and the other side's is taken out: the money truly got dearer. Example: If the franc rises against the dollar only as fast as American prices outrun Swiss ones, a Swiss holiday costs an American the same: no real rise.
- log points
- A way of measuring change in which successive changes add up. For small changes a log point is about a per cent. Example: A rise of ten log points followed by a fall of ten log points brings a price back to where it began.
- effective rate
- A money's exchange rate against a basket of its trading partners, each weighted by its share of trade. Example: The franc's effective rate weighs its rates against the euro, the dollar and other partners by how much Switzerland trades with each.
- Balassa–Samuelson hypothesis
- An explanation of why prices are higher in rich countries: workers there are more productive in goods traded across borders, which raises wages, and so the prices of local services. Example: A haircut costs more in Zurich than in Lisbon, though the barber is no faster: Zurich's barbers earn wages set by its more productive industries.
- money-market fund
- A fund that holds short, safe debts and pays its shares back in money on request, so that its shares work almost like a deposit. Example: A firm parks cash in a money-market fund and takes it out the next day to pay its suppliers.
- stablecoins
- Tokens on a blockchain that promise to stay worth one unit of a money, usually one dollar. Example: USDC promises one dollar per coin, backed by reserves.
- high inflation
- Inflation well above the usual, with no agreed line; Fischer, Sahay and Végh look at several thresholds. Example: A money losing a large part of what it buys each year, short of a hyperinflation.
Where the numbers come from
179
The answer in brief
- 2.5% % a year, average yearly loss of what a unit buys, 1991 to 2025, the US dollar In the text: 6a 6b 6c 6dFirst Thing, computed (opens in a new tab). As of 30 September 2026. How it is computed (opens in a new tab).
- 2% percent per year (PCE price index), the Fed's inflation goal (PCE prices), longer run, the United States In the text: 7a 7bFOMC Statement on Longer-Run Goals, reaffirmed 27 January 2026 (opens in a new tab). As of 27 January 2026.
What is a money's value, and how much has it lost?
- 100 old francs per new franc, old francs per new franc, January 1960, France In the text: 8aBIS 30th Annual Report (opens in a new tab). As of 1 January 1960.
- 1,000,000 old lira (TRL) per new lira (TRY), old lira per new lira, January 2005, Turkey In the text: 9aECB page 'Turkish lira (TRL)' (opens in a new tab). As of 1 January 2005.
- 0.6% % a year, average yearly loss of what a unit buys, 1991 to 2025, the yen In the text: 10a 10b 10cFirst Thing, computed (opens in a new tab). As of 30 September 2026. How it is computed (opens in a new tab).
- 3.6% % a year, average yearly loss of what a unit buys, 1971 to 1991, the Deutsche Mark, then the euro in Germany In the text: 11a 11bFirst Thing, computed (opens in a new tab). As of 30 September 2026. How it is computed (opens in a new tab).
- 8.3% % a year, average yearly loss of what a unit buys, 1971 to 1991, the pound sterling In the text: 12a 12bFirst Thing, computed (opens in a new tab). As of 30 September 2026. How it is computed (opens in a new tab).
- 5.9% % a year, average yearly loss of what a unit buys, 1971 to 1991, the US dollar In the text: 13a 13bFirst Thing, computed (opens in a new tab). As of 30 September 2026. How it is computed (opens in a new tab).
- 1.9% % a year, average yearly loss of what a unit buys, 1913 to 1945, the US dollar In the text: 14aFirst Thing, computed (opens in a new tab). As of 30 September 2026. How it is computed (opens in a new tab).
- 3.1% % a year, average yearly loss of what a unit buys, 1945 to 1971, the US dollar In the text: 15a 15bFirst Thing, computed (opens in a new tab). As of 30 September 2026. How it is computed (opens in a new tab).
- 3.1% % a year, average yearly loss of what a unit buys, 1913 to 1945, the pound sterling In the text: 16aFirst Thing, computed (opens in a new tab). As of 30 September 2026. How it is computed (opens in a new tab).
- 4.3% % a year, average yearly loss of what a unit buys, 1945 to 1971, the pound sterling In the text: 17aFirst Thing, computed (opens in a new tab). As of 30 September 2026. How it is computed (opens in a new tab).
- 2.4% % a year, average yearly loss of what a unit buys, 1991 to 2025, the pound sterling In the text: 18aFirst Thing, computed (opens in a new tab). As of 30 September 2026. How it is computed (opens in a new tab).
- 0.2% % a year, average yearly loss of what a unit buys, 1921 to 1945, the Swiss franc In the text: 19aFirst Thing, computed (opens in a new tab). As of 30 September 2026. How it is computed (opens in a new tab).
- 1.9% % a year, average yearly loss of what a unit buys, 1945 to 1971, the Swiss franc In the text: 20aFirst Thing, computed (opens in a new tab). As of 30 September 2026. How it is computed (opens in a new tab).
- 4.0% % a year, average yearly loss of what a unit buys, 1971 to 1991, the Swiss franc In the text: 21aFirst Thing, computed (opens in a new tab). As of 30 September 2026. How it is computed (opens in a new tab).
- 0.8% % a year, average yearly loss of what a unit buys, 1991 to 2025, the Swiss franc In the text: 22a 22bFirst Thing, computed (opens in a new tab). As of 30 September 2026. How it is computed (opens in a new tab).
- 7.4% % a year, average yearly loss of what a unit buys, 1947 to 1971, the yen In the text: 23aFirst Thing, computed (opens in a new tab). As of 30 September 2026. How it is computed (opens in a new tab).
- 5.0% % a year, average yearly loss of what a unit buys, 1971 to 1991, the yen In the text: 24aFirst Thing, computed (opens in a new tab). As of 30 September 2026. How it is computed (opens in a new tab).
- 4.2% % a year, average yearly loss of what a unit buys, 1951 to 1971, the French franc, then the euro in France In the text: 25aFirst Thing, computed (opens in a new tab). As of 30 September 2026. How it is computed (opens in a new tab).
- 7.3% % a year, average yearly loss of what a unit buys, 1971 to 1991, the French franc, then the euro in France In the text: 26aFirst Thing, computed (opens in a new tab). As of 30 September 2026. How it is computed (opens in a new tab).
- 1.6% % a year, average yearly loss of what a unit buys, 1991 to 2025, the French franc, then the euro in France In the text: 27a 27bFirst Thing, computed (opens in a new tab). As of 30 September 2026. How it is computed (opens in a new tab).
- 1.9% % a year, average yearly loss of what a unit buys, 1949 to 1971, the Deutsche Mark, then the euro in Germany In the text: 28aFirst Thing, computed (opens in a new tab). As of 30 September 2026. How it is computed (opens in a new tab).
- 2.0% % a year, average yearly loss of what a unit buys, 1991 to 2025, the Deutsche Mark, then the euro in Germany In the text: 29a 29bFirst Thing, computed (opens in a new tab). As of 30 September 2026. How it is computed (opens in a new tab).
- 0.5% % a year, average yearly loss of what a unit buys, 1924 to 1945, the Reichsmark In the text: 30aFirst Thing, computed (opens in a new tab). As of 30 September 2026. How it is computed (opens in a new tab).
- 2% percent over the medium term, the ECB's inflation target, over the medium term, the euro area In the text: 31a 31bECB strategy statement 2021 (carried forward in the 2025 overview) (opens in a new tab). As of 1 January 2021.
- $4.86 dollars per pound, the pre-war gold parity of the pound, April 1925, Britain In the text: 32aMoggridge 1972, British Monetary Policy 1924-1931 (opens in a new tab). As of 1 January 1972.
- 10% percent, at least, sterling's overvaluation at the pre-war parity, at least, 1925, Britain In the text: 33aMoggridge 1972, British Monetary Policy 1924-1931 (opens in a new tab). As of 1 January 1972.
Why do people take a money?
- 481 billion shillings (estimate, notes printed since 1991), unofficial shilling notes printed, an estimate, 1991 to about 2010, Somalia In the text: 34aLuther and White 2011, citing Symes 2006a, p. 29 (opens in a new tab). As of 1 January 2006.
- 13 years, years the Swiss dinar's supply stayed fixed, to 2003, northern Iraq In the text: 35aFoote, Block, Crane and Gray 2004 (opens in a new tab). As of 1 January 2004.
- 150 Saddam (new) dinars per Swiss dinar, new dinars per Swiss dinar at the exchange, 2003 to 2004, northern Iraq In the text: 36aFoote et al. 2004 (opens in a new tab). As of 1 January 2004.
- 136% percent (growth of the monetary base over 1999), growth of the monetary base, 1999, Ecuador In the text: 37aBeckerman and Solimano (eds.) 2002, ch. 2 by Beckerman (opens in a new tab). As of 1 June 2002.
- 96% percent (annual CPI change, 2000), rise in consumer prices, 2000, Ecuador In the text: 38aIMF, International Financial Statistics, Ecuador annual CPI (index 23.305 in 1999, 45.701 in 2000), frozen (opens in a new tab). As of 30 September 2026.
What decides how much a unit of money buys?
- 10% percent a year, on average over thirty years, De Grauwe and Polan's line of low inflation, a yearly average, thirty years to the 1990s, their sample In the text: 39aDe Grauwe and Polan 2005, Scandinavian Journal of Economics 107(2) (opens in a new tab). As of 1 June 2005.
- 24% percent fall of the yearly consumer price index, 1870 to 1878 (recomputed 23.6), the fall in US consumer prices from 1870 to 1878, 1870 to 1878, the United States In the text: 40aJordà-Schularick-Taylor Macrohistory Database R6 (opens in a new tab). As of 30 September 2026.
- 39% % of its value in gold, paper's value in gold at its low (par = 100%), 1864-07, the greenback In the text: 41a 41b 41cFirst Thing, computed (opens in a new tab). As of 2 October 2026. How it is computed (opens in a new tab).
- 75% % of its value in gold, paper's value in gold at its low (par = 100%), 1814, the paper pound In the text: 42a 42bFirst Thing, computed (opens in a new tab). As of 2 October 2026. How it is computed (opens in a new tab).
Why were some monies destroyed?
- 3.2 billion Rentenmarks (total issue limit), the limit on Rentenmarks issued, 1923, Germany In the text: 43aSargent 1982 (opens in a new tab). As of 1 January 1982.
- 1.2 billion Rentenmarks (maximum to the government), the limit on Rentenmarks lent to the government, 1923, Germany In the text: 44aSargent 1982 (opens in a new tab). As of 1 January 1982.
- 60 million gold crowns (Debts of the Austrian Government in the Bank's accounts, 23 July 1914), the Austrian government's debts to the Austro-Hungarian Bank, July 1914, Austria In the text: 45aGarber and Spencer 1994, Table 2 (opens in a new tab). As of 1 January 1994.
- 19,694 million gold crowns (same line, 26 October 1918), the Austrian government's debts to the Austro-Hungarian Bank, October 1918, Austria In the text: 46aGarber and Spencer 1994, Table 2 (opens in a new tab). As of 1 January 1994.
- 183% percent, monthly inflation, February 1985, rise in prices in one month, February 1985, Bolivia In the text: 47aSachs 1986, Table 1(c) (opens in a new tab). As of 1 November 1986.
- 25% percent a year, Bolivia's inflation at an annual rate, after the stabilisation, February to October 1986, Bolivia In the text: 48aSachs, 'The Bolivian Hyperinflation and Stabilization', NBER WP 2073 (November 1986) (opens in a new tab). As of 1 November 1986.
- US$1.6 billion billion US dollars (bonds issued by the Treasury Dec 1998 to 1999), Treasury bonds issued to recapitalise banks and pay deposits, 1998 to 1999, Ecuador In the text: 49aBeckerman and Solimano (eds.) 2002, ch. 2 by Beckerman (opens in a new tab). As of 1 June 2002.
- US$1.2 billion billion US dollars (of the bonds, acquired by the Central Bank), of those bonds, acquired by the central bank, 1998 to 1999, Ecuador In the text: 50aBeckerman and Solimano (eds.) 2002, ch. 2 by Beckerman (opens in a new tab). As of 1 June 2002.
- 75% percent of GDP, the central bank's realized quasi-fiscal losses, as a share of GDP, 2006, Zimbabwe In the text: 51aWorld Bank, Zimbabwe Economic Update, Issue 3 (June 2021) (opens in a new tab). As of 1 June 2021.
- 32% percent, rise in consumer prices, 1949, Japan In the text: 52aJST R6 (opens in a new tab). As of 30 September 2026.
- 18% percent, twelve-month change, rise in US consumer prices over twelve months, December 1945 to December 1946, the United States In the text: 53athe BLS's CPI-U, all items, not seasonally adjusted (series CUUR0000SA0, retrieved from the BLS on 21 October 2026; FRED's CPIAUCNS gives the same) (opens in a new tab). As of 21 October 2026.
- 19.7% percent, twelve-month change (the highest of the period), rise in US consumer prices over twelve months, March 1946 to March 1947, the United States In the text: 54athe BLS's CPI-U, all items, not seasonally adjusted (series CUUR0000SA0, retrieved from the BLS on 21 October 2026; FRED's CPIAUCNS gives the same) (opens in a new tab). As of 21 October 2026.
- 25% percent, rise over the twelve months from July 1946, rise in US wholesale prices after price control ended, July 1946 to July 1947, the United States In the text: 55aEichengreen and Garber 1991, 'Before the Accord' (opens in a new tab). As of 1 January 1991.
- 1.1% percent a year, CPI change, 1932 (the lowest of 1932-36 is 1.1 in 1932; 1934's 1.4 is the next), lowest yearly rise in consumer prices, 1932 to 1936, Japan In the text: 56aEggertsson (2006), Table 4 (opens in a new tab). As of 1 January 2006.
- 3.1% percent a year, CPI change, 1933, highest yearly rise in consumer prices, 1932 to 1936, Japan In the text: 57aEggertsson (2006), Table 4 (opens in a new tab). As of 1 January 2006.
- ¥1 billion billion yen, central government bond issues, 1935, central-government bond issues, 1935, Japan In the text: 58aHoshi and Kashyap (2001) (opens in a new tab). As of 1 January 2001.
- ¥33 billion billion yen, central government bond issues, 1945, central-government bond issues, 1945, Japan In the text: 59aHoshi and Kashyap (2001) (opens in a new tab). As of 1 January 2001.
How did a money hold its value, and how did its backing end?
- 1.3 ratio of the August 1917 CPI to the 1914 annual average (recomputed 1.298), consumer prices in August 1917, before the gold embargo, over 1914, 1914 to August 1917, the United States In the text: 60athe BLS's CPI-U, all items, not seasonally adjusted (series CUUR0000SA0, retrieved from the BLS on 21 October 2026; FRED's CPIAUCNS gives the same) (opens in a new tab). As of 21 October 2026.
- 2.0 ratio of annual-average CPI, 1920 to 1914 (recomputed 2.0008; June to June 2.11), consumer prices in 1920 over 1914, 1914 to 1920, the United States In the text: 61athe BLS's CPI-U, all items, not seasonally adjusted (series CUUR0000SA0, retrieved from the BLS on 21 October 2026; FRED's CPIAUCNS gives the same) (opens in a new tab). As of 21 October 2026.
- 2.0 ratio of the consumer price index, 1918 to 1914, consumer prices in 1918 over 1914, 1914 to 1918, Britain In the text: 62aJST R6 (opens in a new tab). As of 30 September 2026.
- 2,400 millions of mandats issued (the ceiling; the record does not name the unit of account), the ceiling on mandats issued, 1796, France In the text: 63aSargent and Velde 1995; White 1995 (opens in a new tab). As of 1 January 1995.
- 35% percent of face value, March 1796, the mandat's value as a share of face value, March 1796, France In the text: 64aSargent and Velde 1995 (opens in a new tab). As of 1 January 1995.
- 6% percent of face value, early summer 1796, the mandat's value as a share of face value, early summer 1796, France In the text: 65aSargent and Velde 1995 (opens in a new tab). As of 1 January 1995.
- 41% percent, end-of-period (December to December) consumer prices, 2002, rise in consumer prices, December to December, 2002, Argentina In the text: 66aIMF WEO via DBnomics (WEO:2008-04 ARG.PCPIEPCH) (opens in a new tab). As of 1 April 2008.
- 3.8 points a year, leavers' consumer-price inflation less stayers', 1932-34, Bernanke and James's economies In the text: 67a 67b 67cFirst Thing, computed (opens in a new tab). As of 30 September 2026. How it is computed (opens in a new tab).
- 11 points a year, interval of leavers' inflation less stayers', high end, 1932-34, Bernanke and James's economies In the text: 68a 68b 68c 68dFirst Thing, computed (opens in a new tab). As of 30 September 2026. How it is computed (opens in a new tab).
- -3.1 points a year, interval of leavers' inflation less stayers', low end, 1932-34, Bernanke and James's economies In the text: 69a 69bFirst Thing, computed (opens in a new tab). As of 30 September 2026. How it is computed (opens in a new tab).
- 4.6 per 100 money-years, crises of a fifth or more in a year begun, before 1914, every money with a price reading In the text: 70aFirst Thing, computed (opens in a new tab). As of 30 September 2026. How it is computed (opens in a new tab).
- 2.9 per 100 money-years, crises of a fifth or more in a year begun, 1914 to July 1971, every money with a price reading In the text: 72aFirst Thing, computed (opens in a new tab). As of 30 September 2026. How it is computed (opens in a new tab).
- 2.2 per 100 money-years, crises of a fifth or more in a year begun, from August 1971, every money with a price reading In the text: 74aFirst Thing, computed (opens in a new tab). As of 30 September 2026. How it is computed (opens in a new tab).
- 3.7 per 100 money-years, consumer-price crises of a fifth or more begun, before 1914, monies with consumer prices In the text: 76aFirst Thing, computed (opens in a new tab). As of 30 September 2026. How it is computed (opens in a new tab).
- 2.2 per 100 money-years, consumer-price crises of a fifth or more begun, from August 1971, monies with consumer prices In the text: 77aFirst Thing, computed (opens in a new tab). As of 30 September 2026. How it is computed (opens in a new tab).
- 166 events, crises of a fifth or more in a year begun, unions once, before 1914, every money with a price reading In the text: 80aFirst Thing, computed (opens in a new tab). As of 30 September 2026. How it is computed (opens in a new tab).
- 3,589 money-years, money-years with a price reading, before 1914, every money with a price reading In the text: 81aFirst Thing, computed (opens in a new tab). As of 30 September 2026. How it is computed (opens in a new tab).
- 43 monies, monies counted, the euro and each union once, before 1914, every money with a price reading In the text: 82a 82bFirst Thing, computed (opens in a new tab). As of 30 September 2026. How it is computed (opens in a new tab).
- 101 events, crises of a fifth or more in a year begun, unions once, 1914 to July 1971, every money with a price reading In the text: 84aFirst Thing, computed (opens in a new tab). As of 30 September 2026. How it is computed (opens in a new tab).
- 3,452 money-years, money-years with a price reading, 1914 to July 1971, every money with a price reading In the text: 85aFirst Thing, computed (opens in a new tab). As of 30 September 2026. How it is computed (opens in a new tab).
- 100 monies, monies counted, the euro and each union once, 1914 to July 1971, every money with a price reading In the text: 86aFirst Thing, computed (opens in a new tab). As of 30 September 2026. How it is computed (opens in a new tab).
- 158 events, crises of a fifth or more in a year begun, unions once, from August 1971, every money with a price reading In the text: 88aFirst Thing, computed (opens in a new tab). As of 30 September 2026. How it is computed (opens in a new tab).
- 7,024 money-years, money-years with a price reading, from August 1971, every money with a price reading In the text: 89aFirst Thing, computed (opens in a new tab). As of 30 September 2026. How it is computed (opens in a new tab).
- 168 monies, monies counted, the euro and each union once, from August 1971, every money with a price reading In the text: 90a 90bFirst Thing, computed (opens in a new tab). As of 30 September 2026. How it is computed (opens in a new tab).
- 3.8 grams of silver, silver in the denarius, Augustus, Rome In the text: 92aButcher and Ponting 2014, The Metallurgy of Roman Silver Coinage (opens in a new tab). As of 1 January 2014.
- 2.76 grams of silver, silver in the denarius, after Nero's reform of 64, Rome In the text: 93aButcher and Ponting 2014, The Metallurgy of Roman Silver Coinage (opens in a new tab). As of 1 January 2014.
- 1.5 grams of silver, silver in the antoninianus, AD 250, Rome In the text: 94aHarper 2016, JEH 76(3) (opens in a new tab). As of 1 January 2016.
- 32% percent, annual change in consumer prices (Reinhart and Rogoff's UK sheet, 'CPI, London'), rise in consumer prices (Reinhart and Rogoff's files), 1800, Britain In the text: 96aReinhart and Rogoff inflation files (opens in a new tab). As of 1 October 2010.
- 5,100 Lit. milliard (financed by the Bank of Italy, 1973), of the deficit, financed by the Bank of Italy, 1973, Italy In the text: 97aBIS 44th Annual Report (opens in a new tab). As of 1 January 1974.
- 7,540 Lit. milliard (the deficit, 1973), the public deficit, 1973, Italy In the text: 98aBIS 44th Annual Report (opens in a new tab). As of 1 January 1974.
- 20% percent, twelve-month change of the consumer price index, rise in Italy's consumer prices over twelve months, August 1973 to August 1974, Italy In the text: 99aIMF International Financial Statistics (PCPI_IX, Italy), through DBnomics (opens in a new tab). As of 30 September 2026.
- 20% percent a year ('more than 20%'), consumer prices 1974 — a floor, not a point value, rise in consumer prices, at least, 1974, Japan In the text: 100aHoshi and Kashyap (2001), ch. 7 (opens in a new tab). As of 1 January 2001.
- 22.7% percent, year-on-year change, BIS long consumer-price series, rise in consumer prices (BIS long series), 1975, Britain In the text: 102aBIS WS_LONG_CPI (opens in a new tab). As of 30 September 2026.
- 0.1% % a year, mean consumer-price inflation in convertible years, 1870-2020, 17 rich economies In the text: 103a 103bFirst Thing, computed (opens in a new tab). As of 30 September 2026. How it is computed (opens in a new tab).
- 3.7% % a year, mean consumer-price inflation in inconvertible years, 1870-2020, 17 rich economies In the text: 104a 104bFirst Thing, computed (opens in a new tab). As of 30 September 2026. How it is computed (opens in a new tab).
- 3.6 points a year, paper years' mean inflation less convertible years', 1870-2020, 17 rich economies In the text: 105aFirst Thing, computed (opens in a new tab). As of 30 September 2026. How it is computed (opens in a new tab).
- 1.9 points a year, interval of paper years' mean inflation less convertible years', low end, 1870-2020, 17 rich economies In the text: 106aFirst Thing, computed (opens in a new tab). As of 30 September 2026. How it is computed (opens in a new tab).
- 5.7 points a year, interval of paper years' mean inflation less convertible years', high end, 1870-2020, 17 rich economies In the text: 107aFirst Thing, computed (opens in a new tab). As of 30 September 2026. How it is computed (opens in a new tab).
- 0.3% % a year, mean consumer-price inflation, fiat years, 1870-1913, 17 rich economies In the text: 108aFirst Thing, computed (opens in a new tab). As of 30 September 2026. How it is computed (opens in a new tab).
- 0.4% % a year, mean consumer-price inflation, convertible years, 1870-1913, 17 rich economies In the text: 109aFirst Thing, computed (opens in a new tab). As of 30 September 2026. How it is computed (opens in a new tab).
- 2.7% % a year, mean consumer-price inflation, fiat years, 1919-1938, 17 rich economies In the text: 110aFirst Thing, computed (opens in a new tab). As of 30 September 2026. How it is computed (opens in a new tab).
- -1.6% % a year, mean consumer-price inflation, convertible years, 1919-1938, 17 rich economies In the text: 111aFirst Thing, computed (opens in a new tab). As of 30 September 2026. How it is computed (opens in a new tab).
- 5.2% % a year, mean consumer-price inflation, Bretton Woods years, 1946-1971, 17 rich economies In the text: 112aFirst Thing, computed (opens in a new tab). As of 30 September 2026. How it is computed (opens in a new tab).
- 4.4% % a year, mean consumer-price inflation, fiat years, 1972-2020, 17 rich economies In the text: 113aFirst Thing, computed (opens in a new tab). As of 30 September 2026. How it is computed (opens in a new tab).
- 14.8% % over twelve months, US consumer prices, change over twelve months, 1980-03, the United States In the text: 114aFirst Thing, computed (opens in a new tab). As of 21 October 2026. How it is computed (opens in a new tab).
- 3.8% % over twelve months, US consumer prices, change over twelve months, 1983-12, the United States In the text: 115aFirst Thing, computed (opens in a new tab). As of 21 October 2026. How it is computed (opens in a new tab).
- 19% percent, policy rate, the central bank's policy rate, August 2021, Turkey In the text: 116aBIS, central bank policy rates (WS_CBPOL) (opens in a new tab). As of 10 October 2026.
- 14% percent, policy rate, the central bank's policy rate, December 2021, Turkey In the text: 117aBIS, central bank policy rates (WS_CBPOL) (opens in a new tab). As of 10 October 2026.
- 19.6% percent, year-on-year change, rise in consumer prices over twelve months, September 2020 to September 2021, Turkey In the text: 118aBIS WS_LONG_CPI (opens in a new tab). As of 30 September 2026.
- 72% percent, consumer prices, rise in consumer prices, 2022, Turkey In the text: 119aOECD Economic Surveys: Türkiye 2023 (opens in a new tab). As of 1 February 2023.
- 9% percent, policy rate after 500 basis points of cuts (Kavcıoğlu's 'down to 9%'); the BIS policy-rate file shows 9 for November and December 2022, the central bank's policy rate, November 2022, Turkey In the text: 120aKavcıoğlu, 28 March 2023 (opens in a new tab). As of 28 March 2023.
- 8.5% percent, policy rate (monthly value 8.5 for April and May 2023, 15 for June), the central bank's policy rate, May 2023, Turkey In the text: 121aBIS, central bank policy rates (WS_CBPOL) (opens in a new tab). As of 10 October 2026.
- 50% percent, policy rate (50 from March to November 2024), the central bank's policy rate, March 2024, Turkey In the text: 122aBIS, central bank policy rates (WS_CBPOL) (opens in a new tab). As of 10 October 2026.
- 59% percent, year-on-year change, BIS long CPI series, rise in consumer prices (BIS long series), 2024, Turkey In the text: 123aBIS WS_LONG_CPI (opens in a new tab). As of 30 September 2026.
- 35% percent, year-on-year change, BIS long CPI series, rise in consumer prices (BIS long series), 2025, Turkey In the text: 124aBIS WS_LONG_CPI (opens in a new tab). As of 30 September 2026.
What makes a money strong abroad?
- 23% percent (dollar share of global export invoicing, commodities removed), dollar share of export invoicing, commodities removed, around 2019, world exports In the text: 125aBoz et al. 2020, IMF WP/20/126 (opens in a new tab). As of 1 July 2020.
- 10% percent (share of global exports destined for the US, commodities removed), share of exports sent to the US, commodities removed, around 2019, world exports In the text: 126aBoz et al. 2020 (opens in a new tab). As of 1 July 2020.
- 57.8% percent (dollar share of allocated official foreign-exchange reserves, constant exchange rates), dollar share of official foreign-exchange reserves, end of 2024, the world's central banks In the text: 127aECB, The international role of the euro, June 2025, drawing on IMF COFER (opens in a new tab). As of 31 December 2024.
- 165 log points, the franc against the dollar: total (BIS rates and consumer prices), 1970 to 2025, the Swiss franc In the text: 128a 128bFirst Thing, computed (opens in a new tab). As of 10 October 2026. How it is computed (opens in a new tab).
- 96 log points, the franc against the dollar: gap (BIS rates and consumer prices), 1970 to 2025, the Swiss franc In the text: 129a 129bFirst Thing, computed (opens in a new tab). As of 10 October 2026. How it is computed (opens in a new tab).
- 68 log points, the franc against the dollar: real (BIS rates and consumer prices), 1970 to 2025, the Swiss franc In the text: 130a 130bFirst Thing, computed (opens in a new tab). As of 10 October 2026. How it is computed (opens in a new tab).
- 156 log points, the franc's narrow effective rate: total (BIS), 1970 to 2025, the Swiss franc In the text: 131aFirst Thing, computed (opens in a new tab). As of 10 October 2026. How it is computed (opens in a new tab).
- 108 log points, the franc's narrow effective rate: gap (BIS), 1970 to 2025, the Swiss franc In the text: 132aFirst Thing, computed (opens in a new tab). As of 10 October 2026. How it is computed (opens in a new tab).
- 48 log points, the franc's narrow effective rate: real (BIS), 1970 to 2025, the Swiss franc In the text: 133aFirst Thing, computed (opens in a new tab). As of 10 October 2026. How it is computed (opens in a new tab).
- 38% % of GDP, Swiss exports of goods and services (World Bank), 1971, Switzerland In the text: 134aFirst Thing, computed (opens in a new tab). As of 10 October 2026. How it is computed (opens in a new tab).
- 78% % of GDP, Swiss exports of goods and services (World Bank), 2025, Switzerland In the text: 135aFirst Thing, computed (opens in a new tab). As of 10 October 2026. How it is computed (opens in a new tab).
- 1.20 CHF per euro (minimum exchange rate), the SNB's minimum exchange rate, September 2011 to January 2015, Switzerland In the text: 136aJordan, 15 January 2015 (opens in a new tab). As of 15 January 2015.
- 11.0% percent fall, fall in euro-invoiced import prices at the border, by the end of 2015, Switzerland In the text: 137aAuer, Burstein and Lein 2021, Table 3 (opens in a new tab). As of 1 January 2021.
- 3.9% percent fall, fall in retail prices of imports, by the end of 2015, Switzerland In the text: 138aAuer, Burstein and Lein 2021, Table 3 (and p. 19) (opens in a new tab). As of 1 January 2021.
- 0.2% percent fall, fall in GDP, first quarter of 2015, Switzerland In the text: 139aOECD Economic Survey of Switzerland 2015 (opens in a new tab). As of 1 November 2015.
- 1.37 times, Swiss GDP price level over the neighbour's, 2025, Switzerland and Austria In the text: 140aFirst Thing, computed (opens in a new tab). As of 10 October 2026. How it is computed (opens in a new tab).
- 1.62 times, Swiss GDP price level over the neighbour's, 2025, Switzerland and Italy In the text: 141aFirst Thing, computed (opens in a new tab). As of 10 October 2026. How it is computed (opens in a new tab).
What are things close to money worth?
- 97 cents per share, the Reserve Primary Fund's share price after repricing, September 2008, the Reserve Primary Fund In the text: 142aMcCabe 2010, FEDS 2010-51 (opens in a new tab). As of 1 January 2010.
- 87 cents (USDC's low against its $1 target, March 2023), USDC's low against its one-dollar target, March 2023, USDC In the text: 143a 143bFederal Reserve FSR, May 2023 (opens in a new tab). As of 8 May 2023.
- 80,300 bitcoin held by the Luna Foundation Guard on 6 May 2022, bitcoin held in reserve by TerraUSD's backers, 6 May 2022, TerraUSD In the text: 144aLiu, Makarov and Schoar 2023, NBER w31160 (opens in a new tab). As of 1 May 2023.
- $2.5 billion billions of dollars spent defending the peg, 7 to 9 May 2022, what TerraUSD's backers spent defending the peg, May 2022, TerraUSD In the text: 145aLiu, Makarov and Schoar 2023, NBER w31160 (opens in a new tab). As of 1 May 2023.
Do today's monies have the two supports?
- 21 million million bitcoins, bitcoin's supply limit, by design, 2012, bitcoin In the text: 146aECB, Virtual Currency Schemes, 2012 (opens in a new tab). As of 1 October 2012.
- 77% % of its dollar price, fall in bitcoin's dollar price, highest to lowest daily price (Coinbase), November 2021 to November 2022, bitcoin In the text: 147aFirst Thing, computed (opens in a new tab). As of 11 October 2026. How it is computed (opens in a new tab).
- 0% percent a year (consumer prices), the bottom of the SNB's price-stability range, today, Switzerland In the text: 148aJordan, speech of 27 April 2023 (BIS); Schlegel, speech of 25 April 2025 (BIS) (opens in a new tab). As of 25 April 2025.
- 2% percent a year (consumer prices), the top of the SNB's price-stability range, today, Switzerland In the text: 149aJordan, speech of 27 April 2023 (BIS); Schlegel, speech of 25 April 2025 (BIS) (opens in a new tab). As of 25 April 2025.
- 99% % of GDP, US federal debt held by the public, share of GDP, first quarter of 2026, the United States In the text: 150aFirst Thing, computed (opens in a new tab). As of 11 October 2026. How it is computed (opens in a new tab).
- 78% % of GDP, US federal debt held by the public, share of GDP, fourth quarter of 2019, the United States In the text: 151aFirst Thing, computed (opens in a new tab). As of 11 October 2026. How it is computed (opens in a new tab).
- 3.2% % of GDP, US federal interest outlays, share of GDP, fiscal year 2025, the United States In the text: 152aFirst Thing, computed (opens in a new tab). As of 11 October 2026. How it is computed (opens in a new tab).
- ¥3 trillion trillions of yen a month, the Bank of Japan's planned monthly outright purchases of government bonds, January-March 2026, Japan In the text: 155aBank of Japan, Statement on Monetary Policy, 31 July 2024 (opens in a new tab). As of 31 July 2024.
- €7.9 billion billions of euros, the ECB's loss for the year, 2024, the European Central Bank In the text: 156aECB, press release of 26 February 2026 on its 2025 financial statements (opens in a new tab). As of 26 February 2026.
- €1.3 billion billions of euros, the ECB's loss for the year, 2025, the European Central Bank In the text: 157aECB, press release of 26 February 2026 on its 2025 financial statements (opens in a new tab). As of 26 February 2026.
- 33 years, years followed by a crisis start within 3 years (debt below 60%, near the world wars and three others, 20% line), 1871-2017, 18 economies (JST) In the text: 158a 158bFirst Thing, computed (opens in a new tab). As of 30 September 2026. How it is computed (opens in a new tab).
- 184 years, economy-years, debt below 60%, near the world wars and three others, 20% line, 1871-2017, 18 economies (JST) In the text: 159a 159bFirst Thing, computed (opens in a new tab). As of 30 September 2026. How it is computed (opens in a new tab).
- 19 years, years followed by a crisis start within 3 years (debt 60-100%, near the world wars and three others, 20% line), 1871-2017, 18 economies (JST) In the text: 160a 160bFirst Thing, computed (opens in a new tab). As of 30 September 2026. How it is computed (opens in a new tab).
- 94 years, economy-years, debt 60-100%, near the world wars and three others, 20% line, 1871-2017, 18 economies (JST) In the text: 161a 161bFirst Thing, computed (opens in a new tab). As of 30 September 2026. How it is computed (opens in a new tab).
- 5 years, years followed by a crisis start within 3 years (debt above 100%, near the world wars and three others, 20% line), 1871-2017, 18 economies (JST) In the text: 162a 162bFirst Thing, computed (opens in a new tab). As of 30 September 2026. How it is computed (opens in a new tab).
- 46 years, economy-years, debt above 100%, near the world wars and three others, 20% line, 1871-2017, 18 economies (JST) In the text: 163a 163bFirst Thing, computed (opens in a new tab). As of 30 September 2026. How it is computed (opens in a new tab).
- 23 years, years followed by a crisis start within 3 years (debt below 60%, away from the world wars and three others, 20% line), 1871-2017, 18 economies (JST) In the text: 164a 164bFirst Thing, computed (opens in a new tab). As of 30 September 2026. How it is computed (opens in a new tab).
- 1,353 years, economy-years, debt below 60%, away from the world wars and three others, 20% line, 1871-2017, 18 economies (JST) In the text: 165a 165bFirst Thing, computed (opens in a new tab). As of 30 September 2026. How it is computed (opens in a new tab).
- 60% % of GDP, band edge on public debt, 1871-2017, 18 economies (JST) In the text: 166a 166b 166c 166dFirst Thing, computed (opens in a new tab). As of 30 September 2026. How it is computed (opens in a new tab).
- 6 years, years followed by a crisis start within 3 years (debt 60-100%, away from the world wars and three others, 20% line), 1871-2017, 18 economies (JST) In the text: 168a 168bFirst Thing, computed (opens in a new tab). As of 30 September 2026. How it is computed (opens in a new tab).
- 462 years, economy-years, debt 60-100%, away from the world wars and three others, 20% line, 1871-2017, 18 economies (JST) In the text: 169a 169bFirst Thing, computed (opens in a new tab). As of 30 September 2026. How it is computed (opens in a new tab).
- 100% % of GDP, band edge on public debt, 1871-2017, 18 economies (JST) In the text: 170a 170b 170c 170d 170eFirst Thing, computed (opens in a new tab). As of 30 September 2026. How it is computed (opens in a new tab).
- 8 years, years followed by a crisis start within 3 years (debt above 100%, away from the world wars and three others, 20% line), 1871-2017, 18 economies (JST) In the text: 172a 172bFirst Thing, computed (opens in a new tab). As of 30 September 2026. How it is computed (opens in a new tab).
- 222 years, economy-years, debt above 100%, away from the world wars and three others, 20% line, 1871-2017, 18 economies (JST) In the text: 173a 173bFirst Thing, computed (opens in a new tab). As of 30 September 2026. How it is computed (opens in a new tab).
- 11 economies, economies, debt above 100%, away from the world wars and three others, 1871-2017, 18 economies (JST) In the text: 175a 175b 175cFirst Thing, computed (opens in a new tab). As of 30 September 2026. How it is computed (opens in a new tab).
- 20% % a year, yearly rise in consumer prices marking a crisis (main), 1871-2017, 18 economies (JST) In the text: 176aFirst Thing, computed (opens in a new tab). As of 30 September 2026. How it is computed (opens in a new tab).
- 7% % of US adults, share of adults who bought or held cryptocurrency as an investment, 2024, US adults In the text: 178aFederal Reserve, Economic Well-Being of U.S. Households in 2024 (May 2025) (opens in a new tab). As of 1 May 2025.
- 2% % of US adults, share of adults who used cryptocurrency to buy something or make a payment, 2024, US adults In the text: 179aFederal Reserve, Economic Well-Being of U.S. Households in 2024 (May 2025) (opens in a new tab). As of 1 May 2025.